Copyright
©The Author(s) 2016.
World J Gastroenterol. May 14, 2016; 22(18): 4466-4483
Published online May 14, 2016. doi: 10.3748/wjg.v22.i18.4466
Published online May 14, 2016. doi: 10.3748/wjg.v22.i18.4466
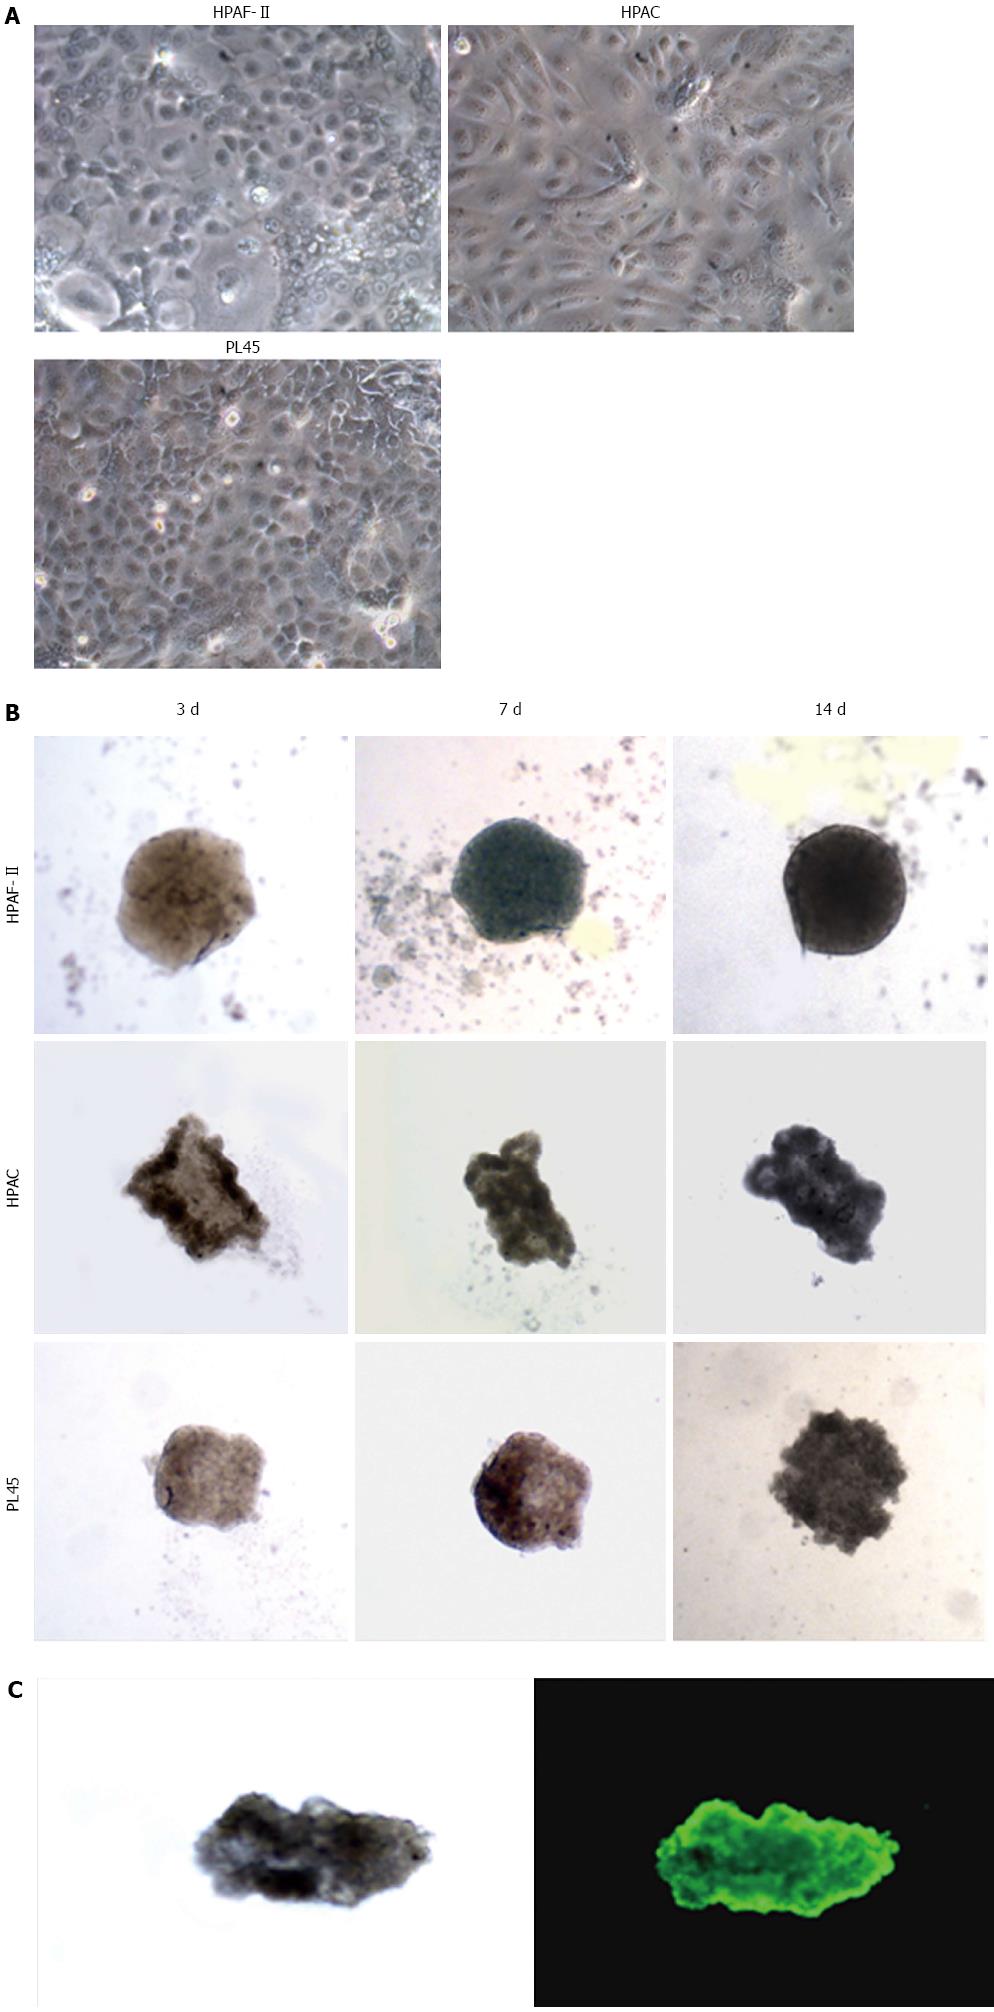
Figure 1 Morphology of pancreatic adenocarcinoma cells grown in 2D-monolayers and 3D-spheroids.
A: Micrograph from inverted microscope showing the epithelial morphology of HPAF-II, HPAC, and PL45 cells grown in 2D-monolayers. Original magnification: 20 ×; B: 3D-spheroids observed under inverted microscope after 3, 7, and 14 d. HPAF-II spheroids were more rounded and uniformly dense; by contrast, HPAC and PL45 spheroids displayed an irregular shape. Original magnification: 10 ×; C: Representative 3D-spheroid under inverted microscope and after incubation with calcein-AM. Original magnification: 10 ×.
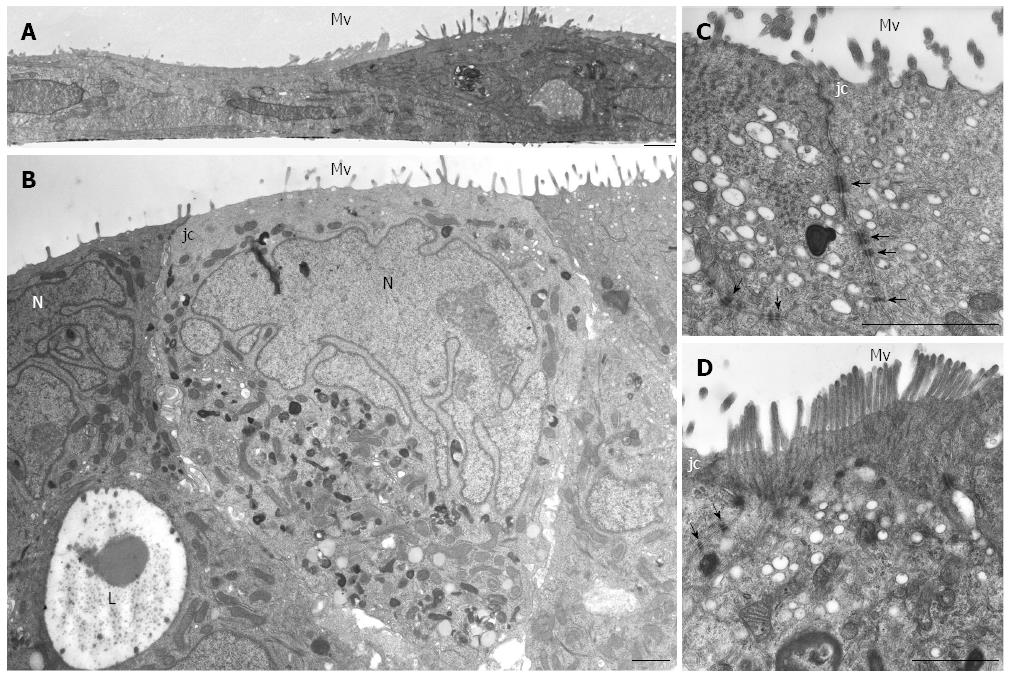
Figure 2 HPAF-II ultrastructure.
A: Electron microscopy of HPAF-II culture grown in a 2D-monolayer showing two cells partially overlapping and exhibiting microvilli (Mv). Scale bar = 1 μm; B-D: Ultrastructural features of HPAF-II cells grown in 3D-spheroids. Adjacent cells located at the periphery of the spheroid show microvilli (Mv) in the apical domain and junctional complexes (jc). In B, some cells exhibit a pale and markedly irregular nucleus (N). Some adjacent cells delimit a lumen-like structure (L). Scale bar = 1.5 μm. C, D: Adjoined cells are connected by junctional complexes (jc) in their apical-lateral domains and by numerous adherens junctions (arrows) in their lateral domains. In D, microvilli are densely packed; at their core, actin microfilaments can be seen extending into the apical cytoplasm. C, D: scale bar = 1.5 μm.
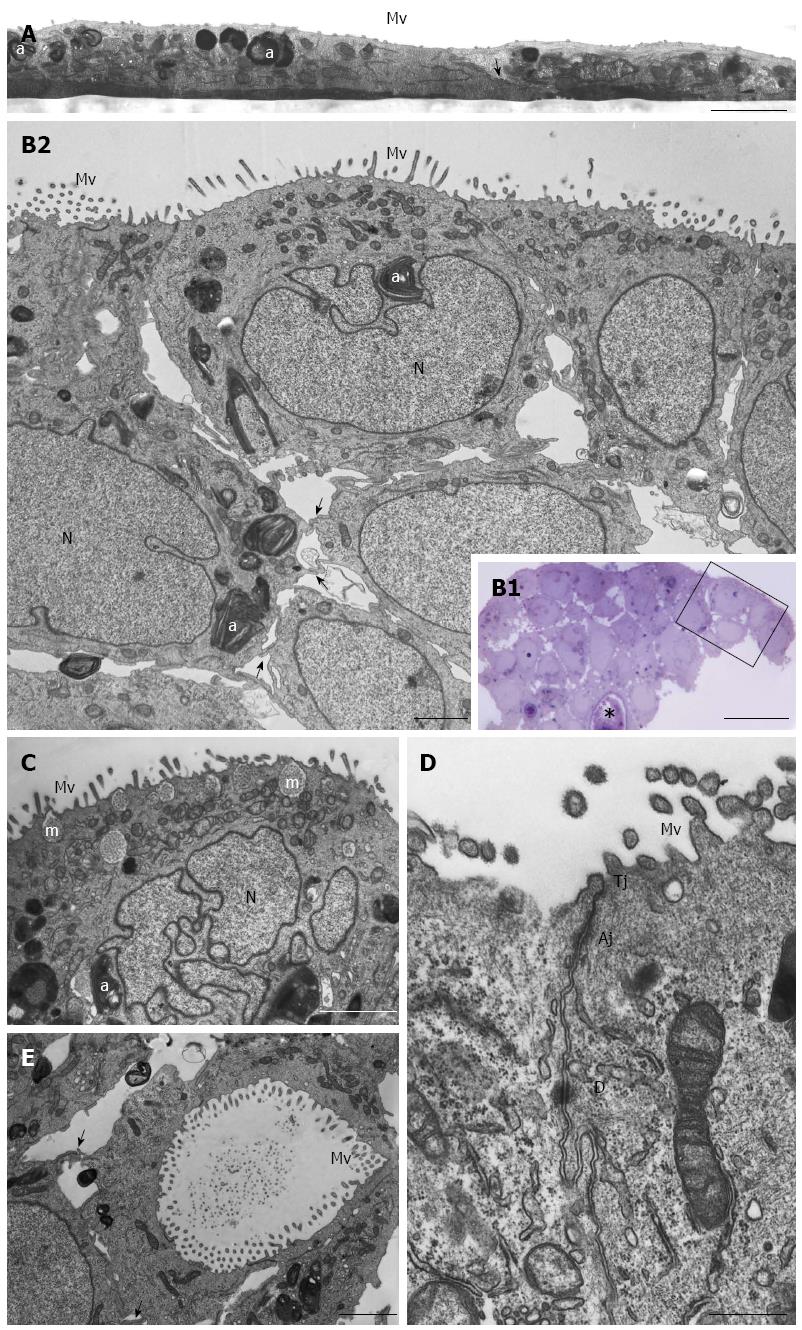
Figure 3 HPAC ultrastructure.
A: Electron microscopy of a HPAC 2D-monolayer. Two cells having dark and light cytoplasm, respectively, are partially overlapped and interdigitated by finger-like projections (arrow); sparse and short microvilli (Mv) in the domain facing the culture medium and some autophagosomes (a) can be seen. Scale bar = 2 μm; B1: Light microscopy of a semi-thin section showing a representative area of a multilayered 3D-spheroid. The asterisk indicates a lumen-like structure. Ultrastructural features of the boxed area are shown in B2. Scale bar = 20 μm; B2: Electron microscopy of the thin section immediately adjacent to the semi-thin one, and corresponding to the boxed area in B1, shows cellular polarity and numerous microvilli (Mv) in the apical domain facing the culture medium. Several autophagosomes (a) can be observed in the cytoplasm. Cells of the lower region exhibit interdigitating finger-like processes (arrows) in the interstitial space. Nuclei (N) are euchromatic and frequently display more or less deep invaginations. Scale bar = 5 μm; C: Micrograph showing a cell with a markedly irregular nucleus (N) and several mucin granules (m) in the apical cytoplasm. Scale bar = 2 μm; D: Thin section of two adjacent cells located at the periphery of the spheroid and facing the culture medium. Microvilli (Mv) in the apical domain and a junctional complex, consisting of tight junction (Tj), adherens junction (Aj), and desmosome (D) in the lateral domain, can be observed. Scale bar = 0.5 μm; E: Micrograph of the inner part of a spheroid in which some adjacent interdigitated cells (arrows) delimiting a lumen-like structure exhibit numerous microvilli in their apical domains and junctional specializations (arrows). Scale bar = 2 μm
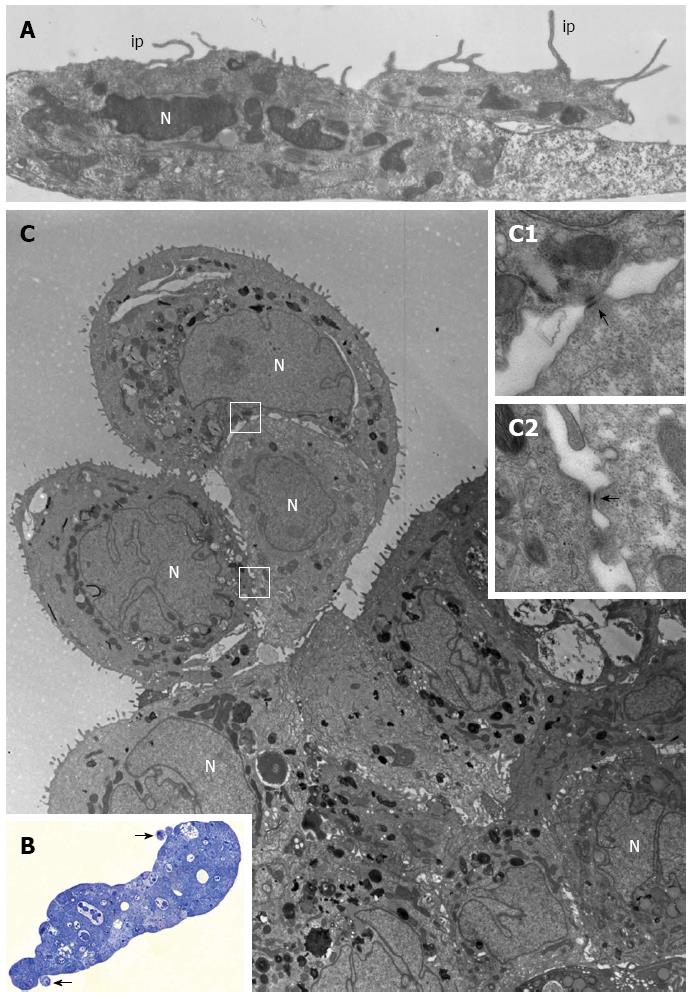
Figure 4 PL45 ultrastructure.
A: Electron microscopy of two PL45 cells grown in 2D-monolayers that exhibit protrusions consistent with invadopodia (ip) originating from their surface and projecting toward the culture medium. N: Nucleus. Scale bar = 1 μm; B: Light microscopy of a semi-thin section showing a multilayered spheroid with 2 small groups of cells partially detached from the periphery of the spheroid (arrows). Scale bar = 40 μm; C: Electron microscopy of a thin section adjacent to the semi-thin one showing a group consisting of 3 cells joined to each other. The outlined areas are shown at greater enlargement in inserts C1 and C2; arrows indicate desmosomes. N: Nucleus. Scale bar = 5 μm. Inset scale bar = 0.25 μm.
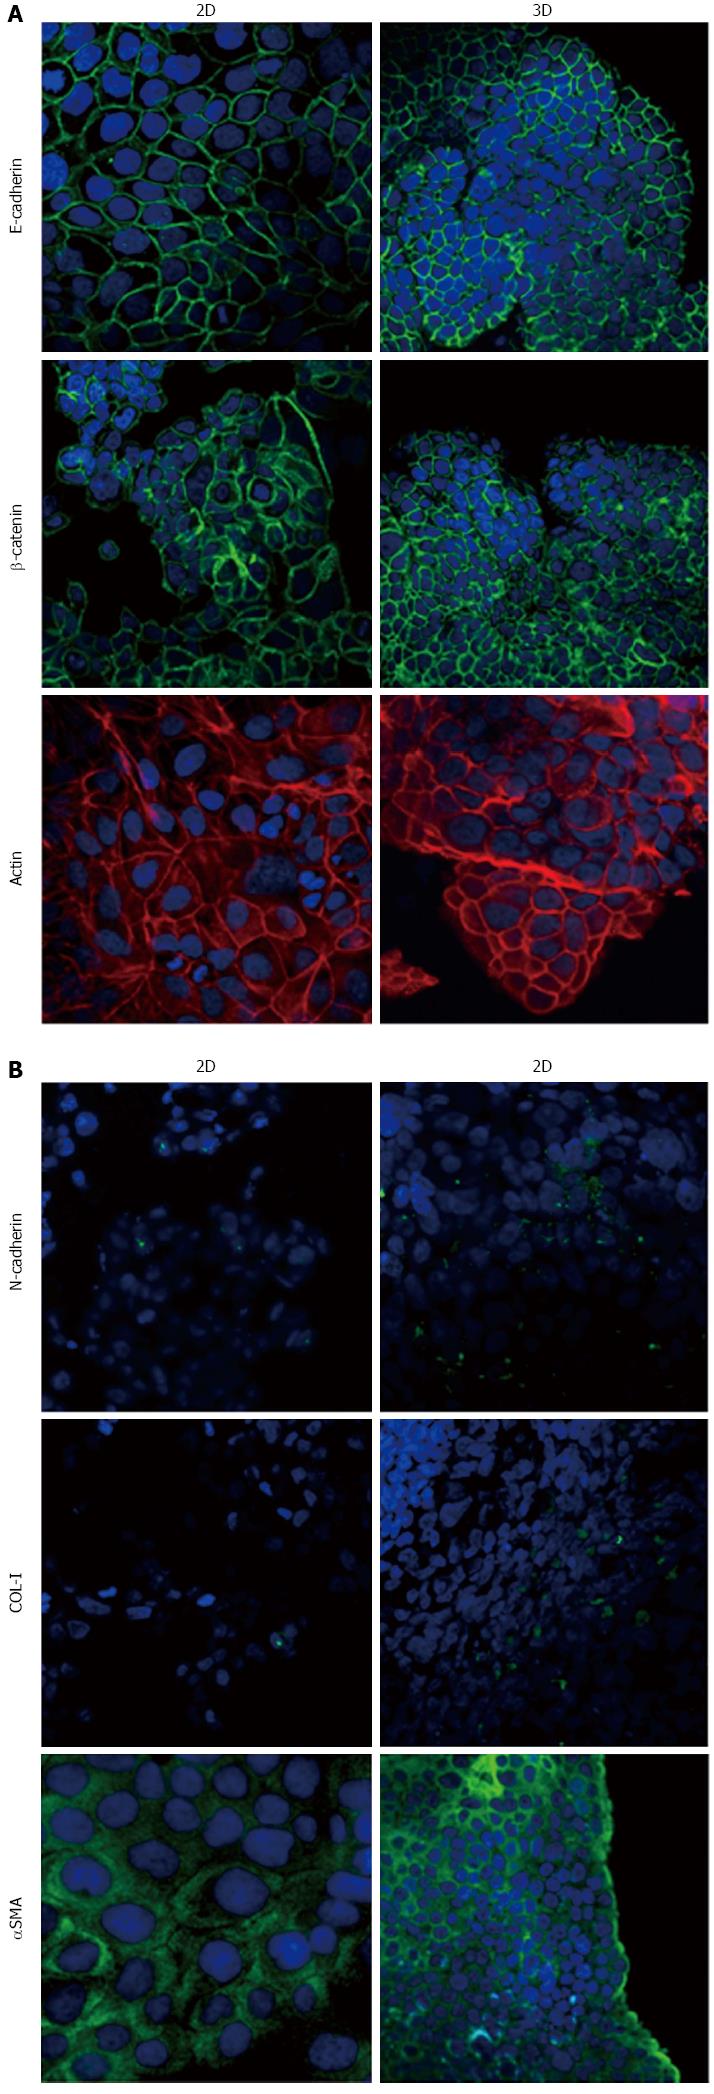
Figure 5 Expression of epithelial-to-mesenchymal transition-related markers in HPAF-II cells.
Micrographs using a confocal microscope showing epithelial (A) and mesenchymal markers (B) in HPAF-II cells grown in 2D-monolayers and 3D-spheroids. Original magnification: 60 ×.
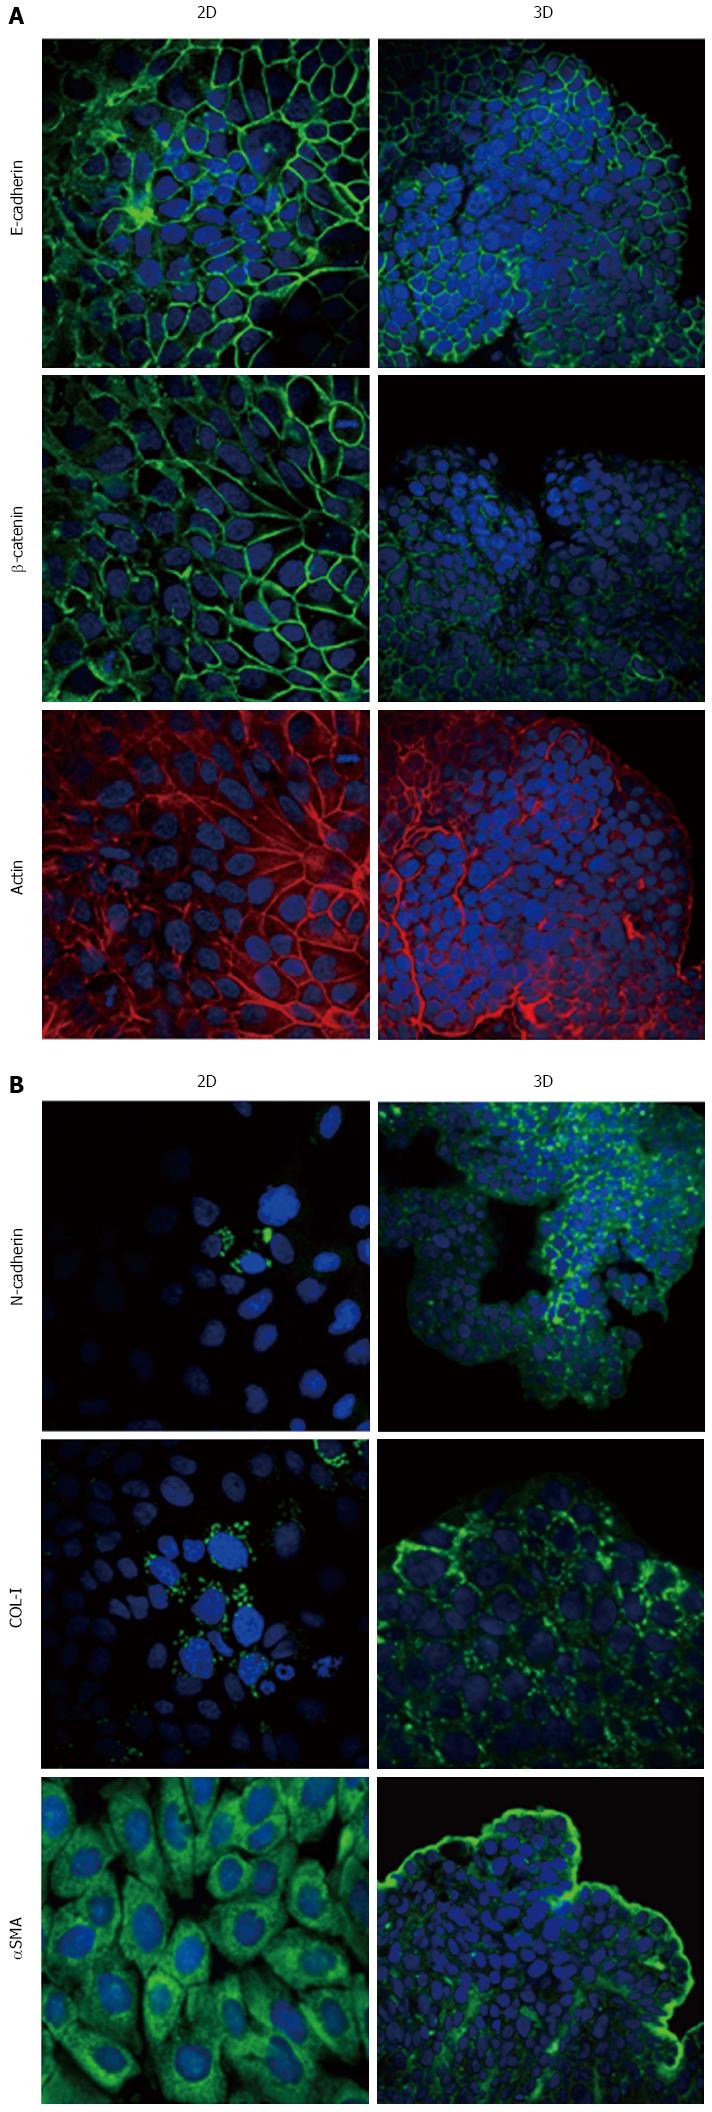
Figure 6 Expression of epithelial-to-mesenchymal transition-related markers in HPAC cells.
Micrographs using a confocal microscope showing epithelial (A) and mesenchymal markers (B) in HPAC cells grown in 2D-monolayers and 3D-spheroids. Original magnification: 60 ×.
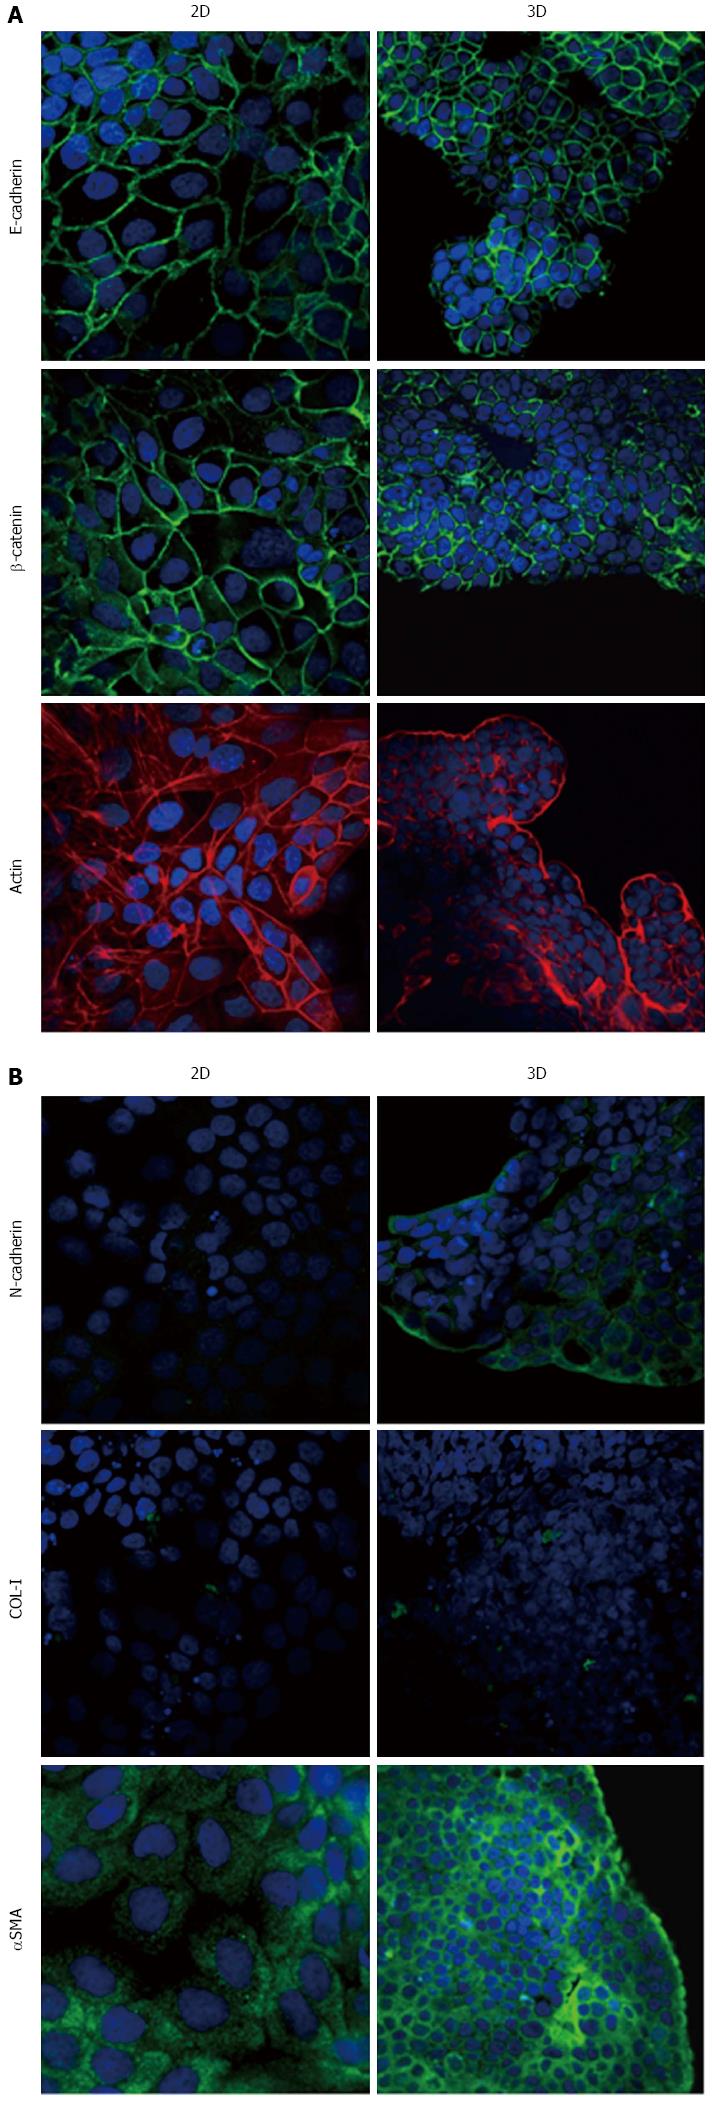
Figure 7 Expression of epithelial-to-mesenchymal transition-related markers in PL45 cells.
Micrographs using a confocal microscope showing epithelial (A) and mesenchymal markers (B) in PL45 cells grown in 2D-monolayers and 3D-spheroids. Original magnification: 60 ×.
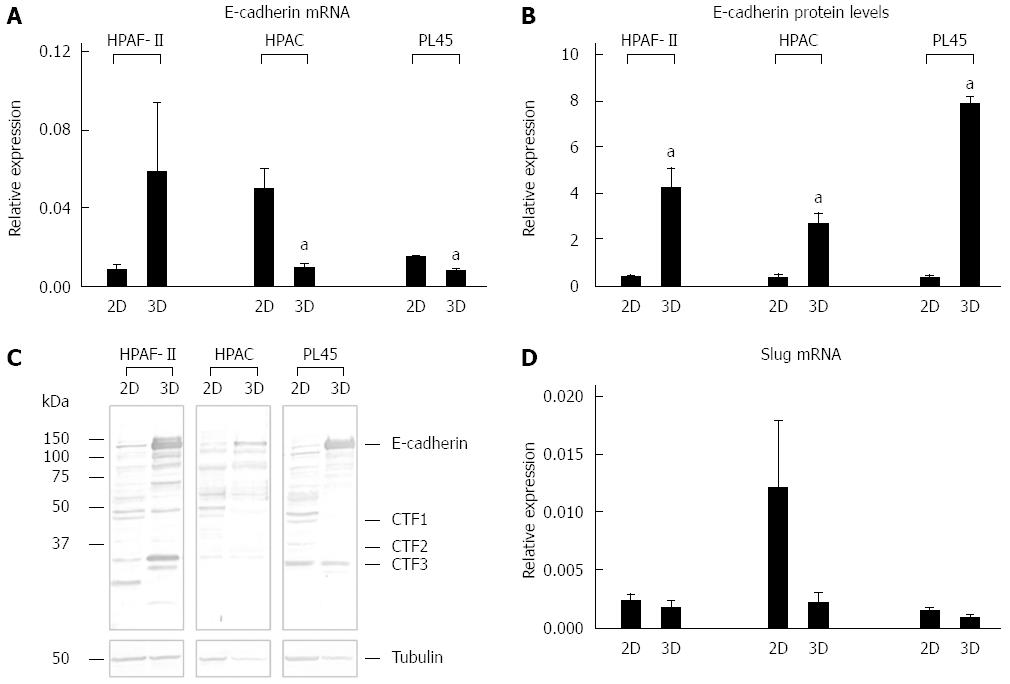
Figure 8 E-cadherin gene and protein expression, and Slug mRNA levels.
Bar graphs showing E-cadherin gene (A) and protein expression (B) analyzed by real-time PCR and Western blot, respectively. Data are mean ± SD of duplicate samples run in duplicate experiments; C: Representative Western blot showing the electrophoretic pattern of E-cadherin in lysates obtained from HPAF-II, HPAC, and PL45 cells grown in 2D-monolayers or 3D-spheroids; D: mRNA levels for Slug in PDAC cells assayed by real time PCR. Data are mean ± SD of duplicate samples run in duplicate experiments. a: Cohen’s d > 2.
Figure 9 Podoplanin expression and actin cytoskeleton.
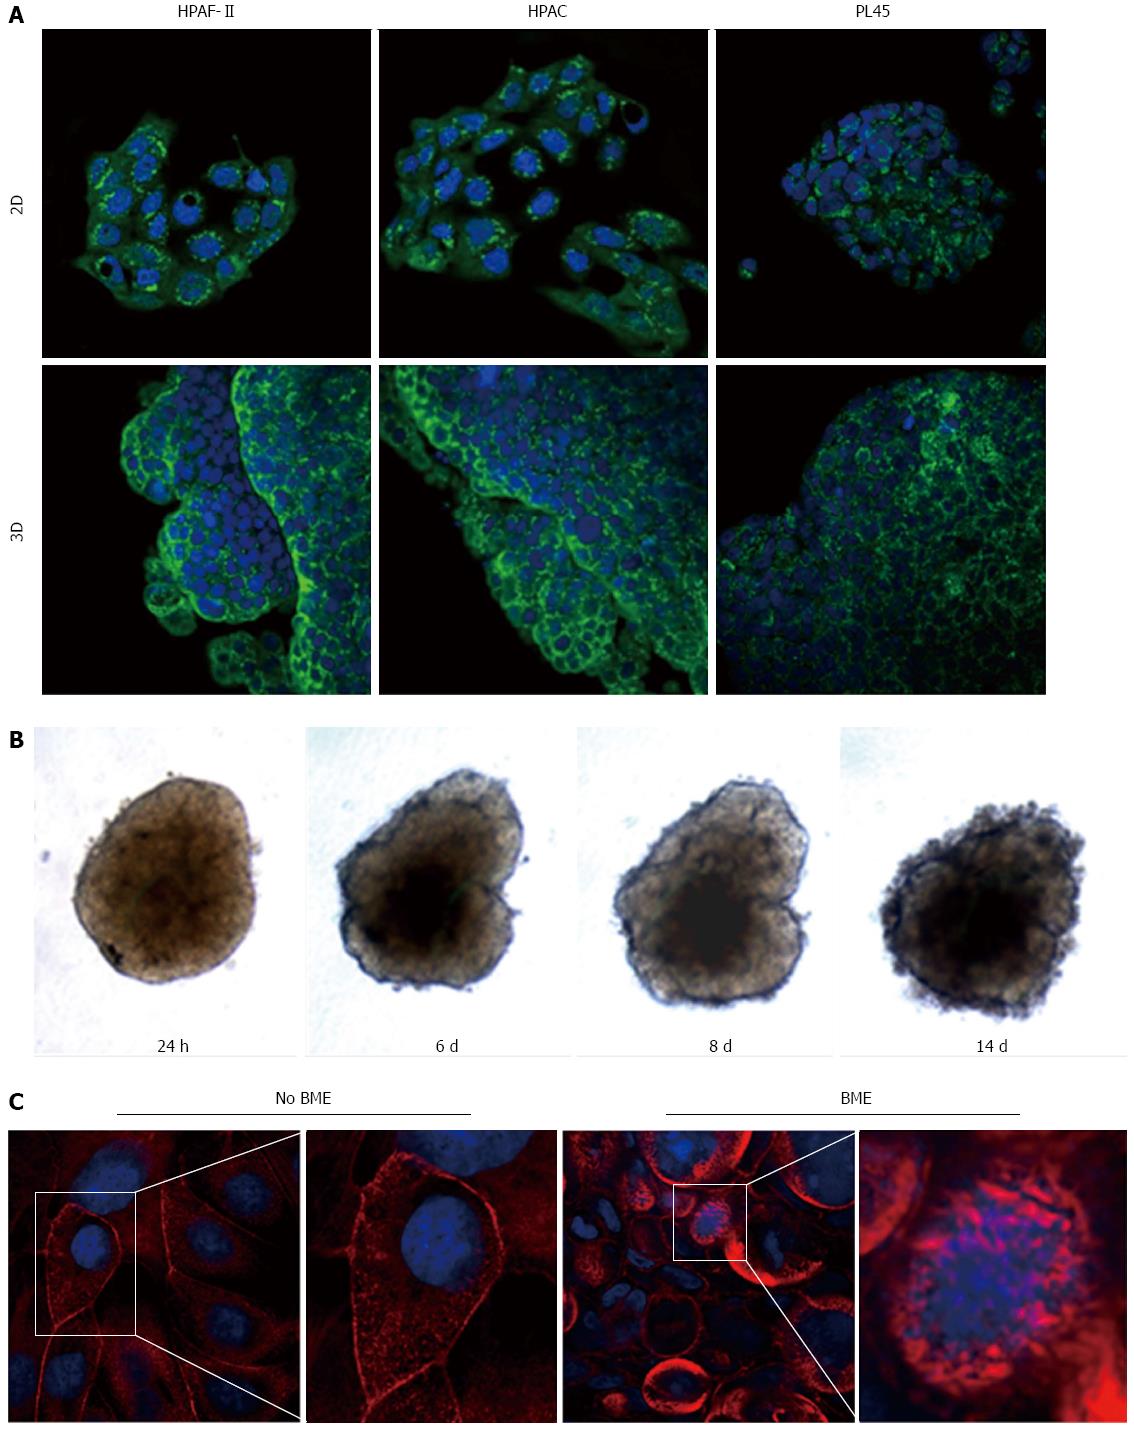
A: Micrographs with a confocal microscope of PDAC cells grown in 2D-monolayers and 3D-spheroids, showing the expression of podoplanin. Punctuate immunoreactivity is located in the cytoplasm. Original magnification: 60 ×; B: HPAF-II 3D-spheroid grown in basement membrane extract (BME) monitored at different time points; C: HPAF-II 3D-spheroids grown in the absence or presence of BME were stained using rhodamine-phalloidin to detect actin filaments. Invadopodia are evident boxed. Original magnification: 60 ×.
- Citation: Gagliano N, Celesti G, Tacchini L, Pluchino S, Sforza C, Rasile M, Valerio V, Laghi L, Conte V, Procacci P. Epithelial-to-mesenchymal transition in pancreatic ductal adenocarcinoma: Characterization in a 3D-cell culture model. World J Gastroenterol 2016; 22(18): 4466-4483
- URL: https://www.wjgnet.com/1007-9327/full/v22/i18/4466.htm
- DOI: https://dx.doi.org/10.3748/wjg.v22.i18.4466


