Copyright
©The Author(s) 2016.
World J Gastroenterol. Apr 28, 2016; 22(16): 4191-4200
Published online Apr 28, 2016. doi: 10.3748/wjg.v22.i16.4191
Published online Apr 28, 2016. doi: 10.3748/wjg.v22.i16.4191
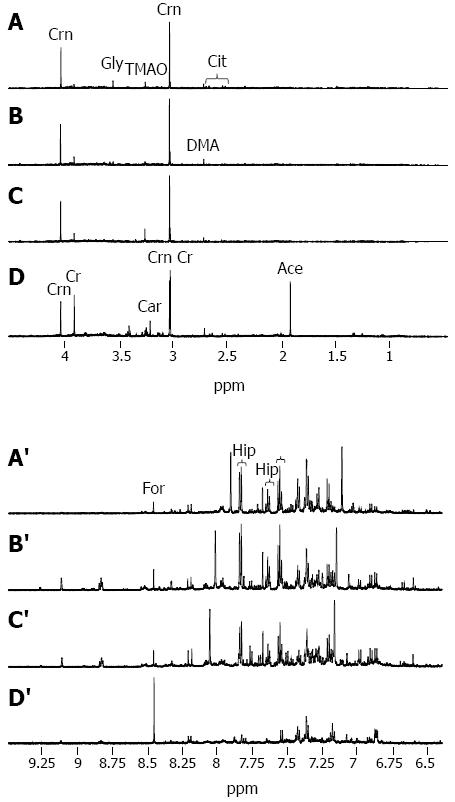
Figure 1 Illustrative urinary proton nuclear magnetic resonance spectra.
From a 35 year old healthy control (CTR) (A, A’); a 22 year old male with chronic hepatitis-B related liver disease (CHB) (B, B’); a 36 year old male with hepatitis B virus (HBV)-cirrhosis (C, C’); and a 50 year old male with HBV-hepatocellular carcinoma (AFP > 30000 mg/dL) displaying (A-D) the aliphatic region 0.5-4.5 ppm and (A’-D’) the aromatic region 6.4-9.5 ppm (D, D’). Each NMR spectrum is scaled independently. The more prominent peaks are assigned and include acetate (Ace), carnitine (Car), citrate (Cit), creatine (Cr), creatinine (Crn), dimethylamine (DMA), formate (For), glycine (Gly), hippurate (Hip), histidine (His), and trimethylamine-N-oxide (TMAO).
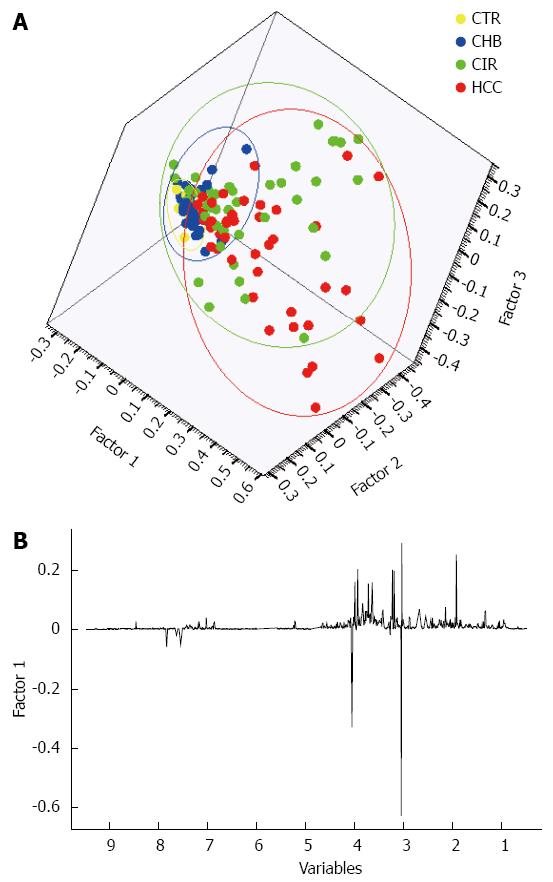
Figure 2 A three-factor principal components analysis scores plot of the cohort of 142 subjects and clustering of each of the four subgroups.
A: Principal components analysis (PCA) scatter plot showing clustering and separation of healthy controls (CTR), chronic hepatitis-B related liver disease (CHB), cirrhosis (CIR), and hepatocellular carcinoma (HCC) subgroups; B: The associated loadings plot illustrating the metabolites contributing to the separation of the subgroups.
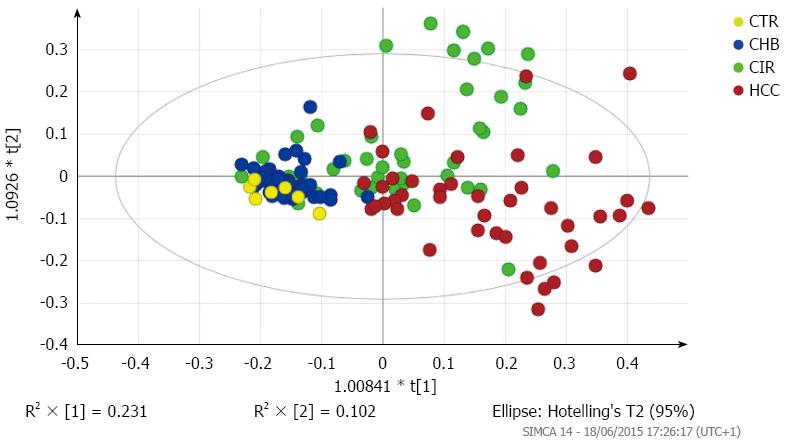
Figure 3 Scores plot of orthogonal partial least squares discriminant analysis (OPLS-DA) model of CTR, CHB, CIR, and HCC subgroups.
R2(X), R2(Y) and Q2 values were 0.468, 0.289, and 0.195, respectively.
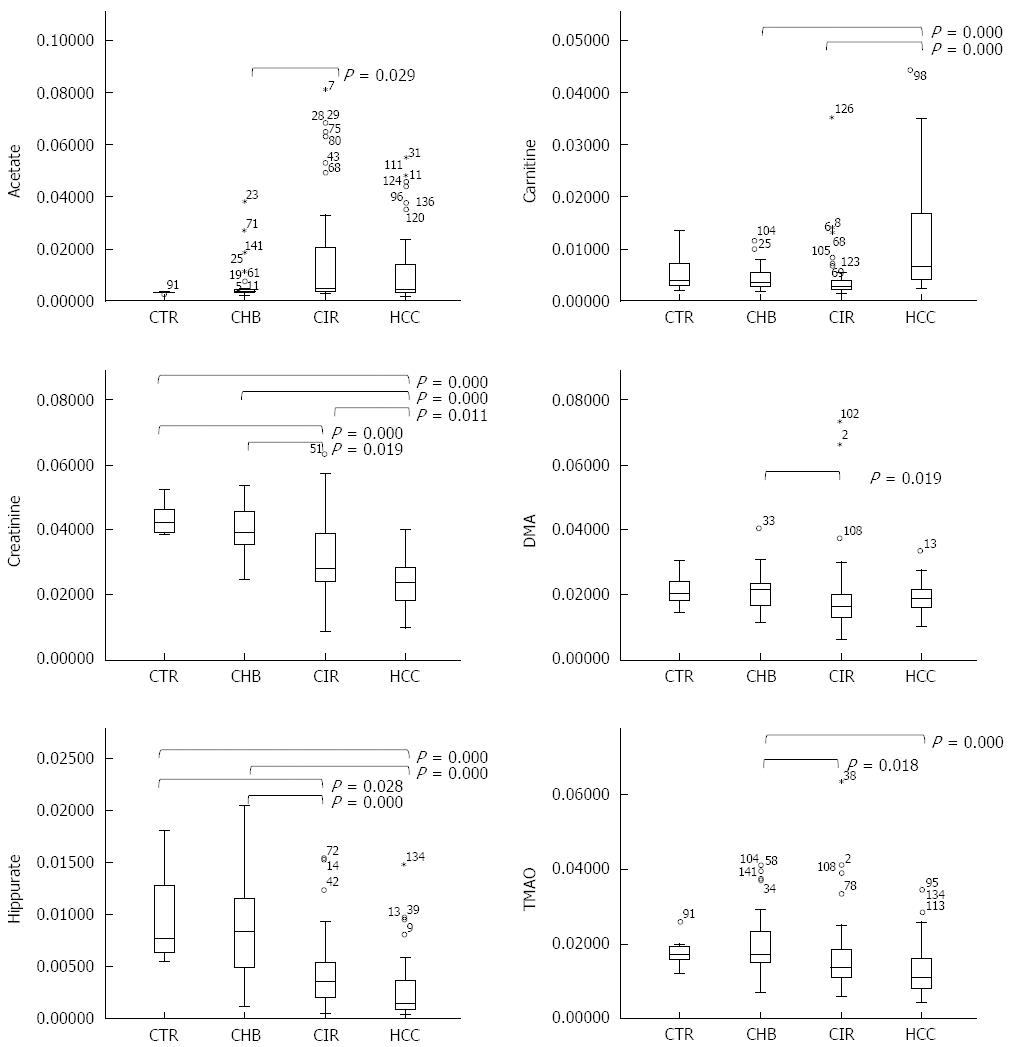
Figure 4 Boxplots of selected metabolites.
Metabolites [acetate, carnitine, creatinine, dimethylamine (DMA), hippurate, and trimethylamine-N-oxide (TMAO)], showing the results of a comparison of signal levels (normalized to 1) using an independent-samples Kruskal-Wallis test.
- Citation: Cox IJ, Aliev AE, Crossey MM, Dawood M, Al-Mahtab M, Akbar SM, Rahman S, Riva A, Williams R, Taylor-Robinson SD. Urinary nuclear magnetic resonance spectroscopy of a Bangladeshi cohort with hepatitis-B hepatocellular carcinoma: A biomarker corroboration study. World J Gastroenterol 2016; 22(16): 4191-4200
- URL: https://www.wjgnet.com/1007-9327/full/v22/i16/4191.htm
- DOI: https://dx.doi.org/10.3748/wjg.v22.i16.4191


