Copyright
©The Author(s) 2016.
World J Gastroenterol. Apr 28, 2016; 22(16): 4149-4159
Published online Apr 28, 2016. doi: 10.3748/wjg.v22.i16.4149
Published online Apr 28, 2016. doi: 10.3748/wjg.v22.i16.4149
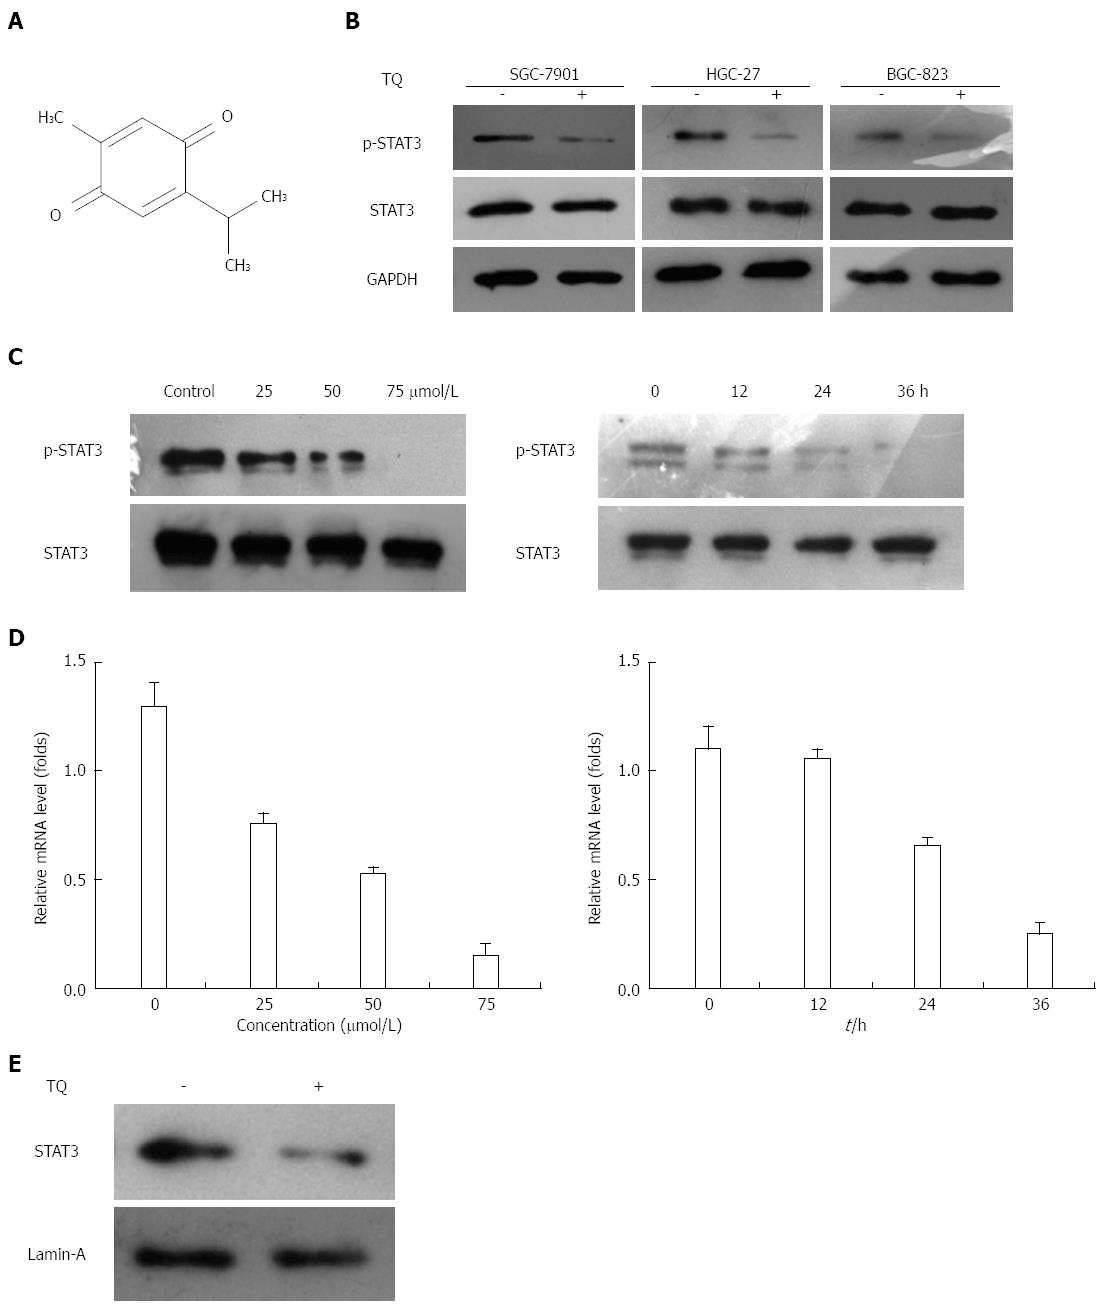
Figure 1 Thymoquinone suppresses constitutive STAT3 activation in three gastric cancer cell lines.
A: Human gastric cancer cells (HGC27, BGC823, and SGC7901) were incubated with 50 μmol/L thymoquinone (TQ) for 24 h, and western blotting was performed as described previously; B: The same blots were stripped and reprobed with the GAPDH antibody to verify equal protein loading; C: TQ suppressed phospho-STAT3 levels in a concentration- and time-dependent manner. HGC27 cells (1 × 10⁶/mL) were treated with the indicated concentrations of TQ for 24 h, and western blotting was performed (left). HGC27 cells (1 × 10⁶/mL) were treated with 50 μmol/L TQ for the indicated times, and western blotting was performed (right). The same blots were stripped and reprobed with the STAT3 antibody to verify equal protein loading; D: TQ suppressed STAT3 gene levels in a concentration- and time-dependent manner. HGC27 cells (1 × 10⁶/mL) were treated with the indicated concentrations of TQ for 24 h, and real-time RT-PCR was performed (left). HGC27 cells (1 × 10⁶/mL) were treated with 50 μmol/L TQ for the indicated times, and real-time RT-PCR was performed (right); E: TQ suppressed STAT3 nuclear translocation. HGC27 cells (1 × 10⁶/mL) cells were treated with or without 50 μmol/L TQ for 24h, and nuclear extracts were assessed for the detection nuclear accumulation of STAT3. Lamin-A was used as a nuclear extract marker. GAPDH: Glyceraldehyde-3-phosphate dehydrogenase; RT-PCR: Reverse transcription polymerase chain reaction; STAT: Signal transducer and activator of transcription.
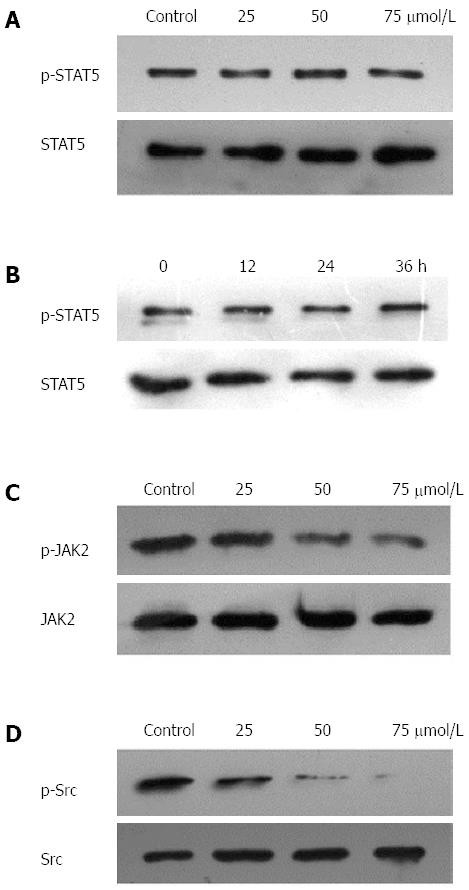
Figure 2 Thymoquinone suppresses phospho-JAK2 and phospho-Src levels, but not STAT5 levels.
A: HGC27 cells (1 × 10⁶/mL) were treated with the indicated concentrations of thymoquinone (TQ) for 24 h, and western blotting was performed; B: HGC27 cells (1 × 10⁶/mL) were treated with 50 μmol/L TQ for the indicated times, and western blotting was performed. The same blots were stripped and reprobed with the STAT5 antibody to verify equal protein loading; C: TQ suppressed phospho-JAK2 levels in a concentration -dependent manner. HGC27 cells (1 × 10⁶/mL) were treated with the indicated concentrations of TQ for 24 h, and Western blotting was performed. The same blots were stripped and reprobed with the JAK2 antibody to verify equal protein loading; D: TQ suppressed phospho-Src levels in a concentration -dependent manner. HGC27 cells (1 × 10⁶/mL) were treated with the indicated concentrations of TQ for 24 h, and Western blotting was performed. The same blots were stripped and reprobed with the Src antibody to verify equal protein loading. JAK: Janus-activated kinase.
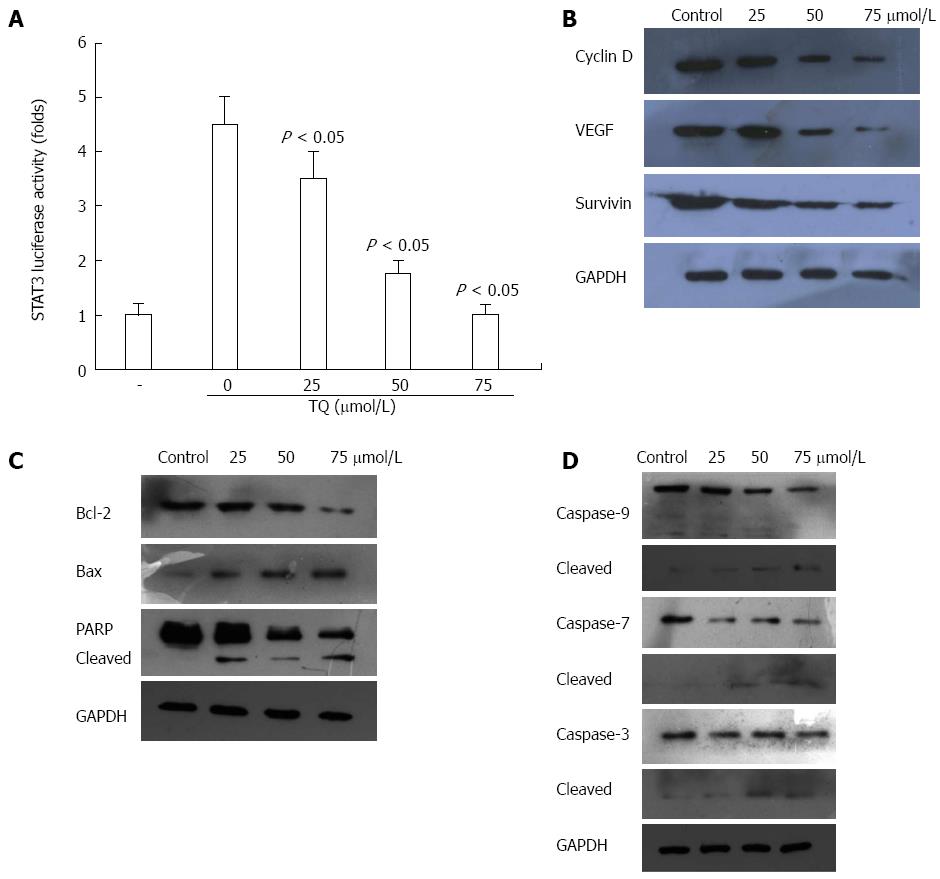
Figure 3 Thymoquinone suppresses STAT3-dependent reporter gene expression and activates caspase activity.
A: Thymoquinone (TQ) suppressed STAT3 transcriptional activity. HGC27 cells (1 × 10⁶/mL) were transfected with STAT3-luciferase (STAT3-Luc) plasmid, incubated for 24 h, and treated with 25, 50, and 75 μmol/L TQ for 24 h. Whole-cell extracts were then prepared and analyzed for luciferase activity. The results shown are representative of three independent experiments; B: TQ inhibited the expression of Cyclin D, survivin, and VEGF. HGC27 cells (1 × 10⁶/mL) were treated with the indicated concentrations of TQ for 24 h, and western blotting was performed. The same blots were stripped and reprobed with the GAPDH antibody to verify equal protein loading; C: HGC27 cells (1 × 10⁶/mL) were treated with the indicated concentrations of TQ for 24 h, and whole-cell extracts were prepared, separated by SDS-PAGE, and subjected to western blot against Bcl-2, Bax, and PARP antibody. The same blot was stripped and reprobed with GAPDH antibody to show equal protein loading; (D) TQ activates caspase activity. HGC27 cells (1 × 10⁶/mL) were treated with the indicated concentrations of TQ for 24 h, and western blotting was performed. The results shown are representative of three independent experiments. PARP: Poly(ADP-ribose)polymerase
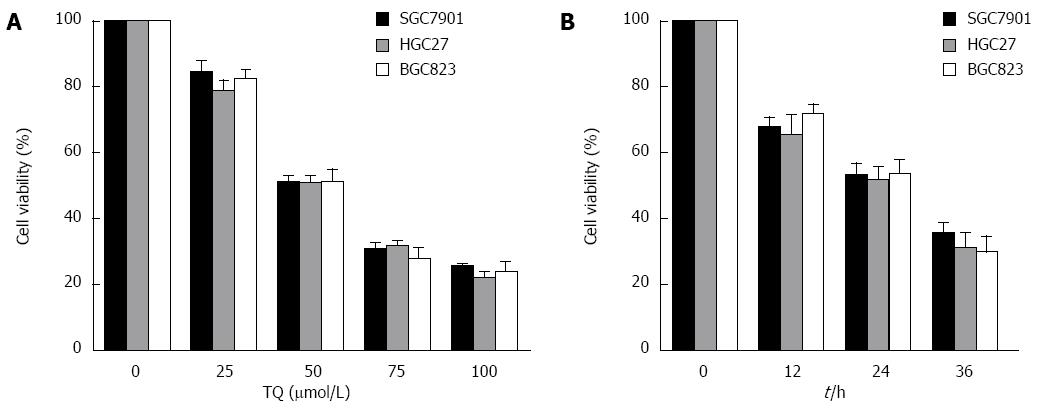
Figure 4 Thymoquinone inhibits proliferation in gastric cancer cells.
A: Gastric cancer cells were treated with 25 μmol/L, 50 μmol/L, or 100 μmol/L TQ for 24 h, after which an MTT assay was performed; B: Cells were treated with 50 μmol/L TQ for 12, 24, or 36 h, and an MTT assay was performed. TQ: Thymoquinone.
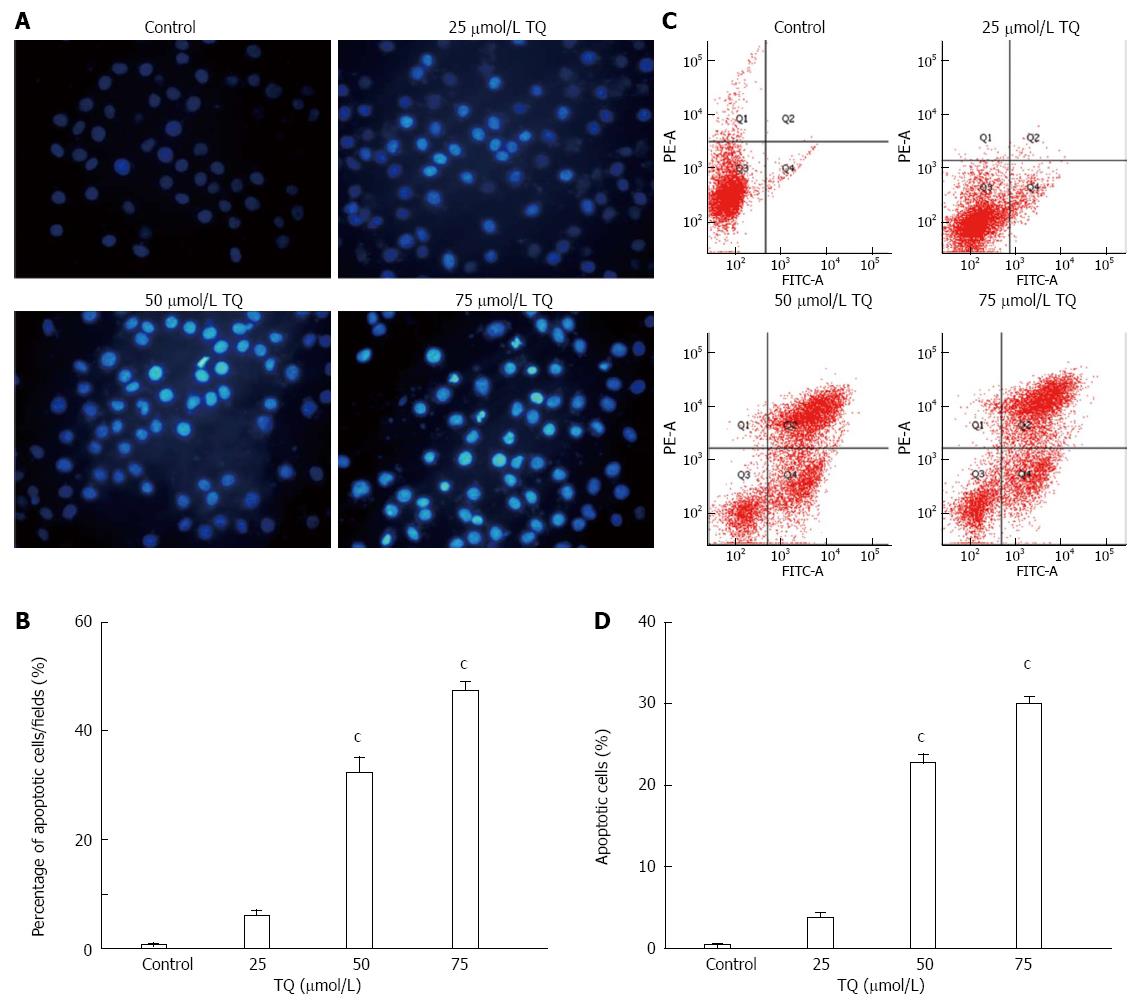
Figure 5 Thymoquinone induces apoptosis in HGC27 cells.
A: Detection of apoptosis via Annexin V/PI staining (X-axis: annexin V; Y-axis: PI). The proportion of non-apoptotic cells (Q3), early apoptotic cells (Q4), late apoptotic/necrotic cells (Q2), and cell debris or death cell (Q1); B: Data shown are mean ± SD from three independent experiments; C: Apoptosis was assessed using Hoechst 33258, and apoptotic features were assessed by observing chromatin condensation and fragment staining (original magnification, × 200); D: Quantitative analysis of apoptotic cells is represented as the mean ± SD from three independent experiments. cP < 0.05, vs control and 25 μmol/L TQ. PI: Propidium iodide; TQ: Thymoquinone.
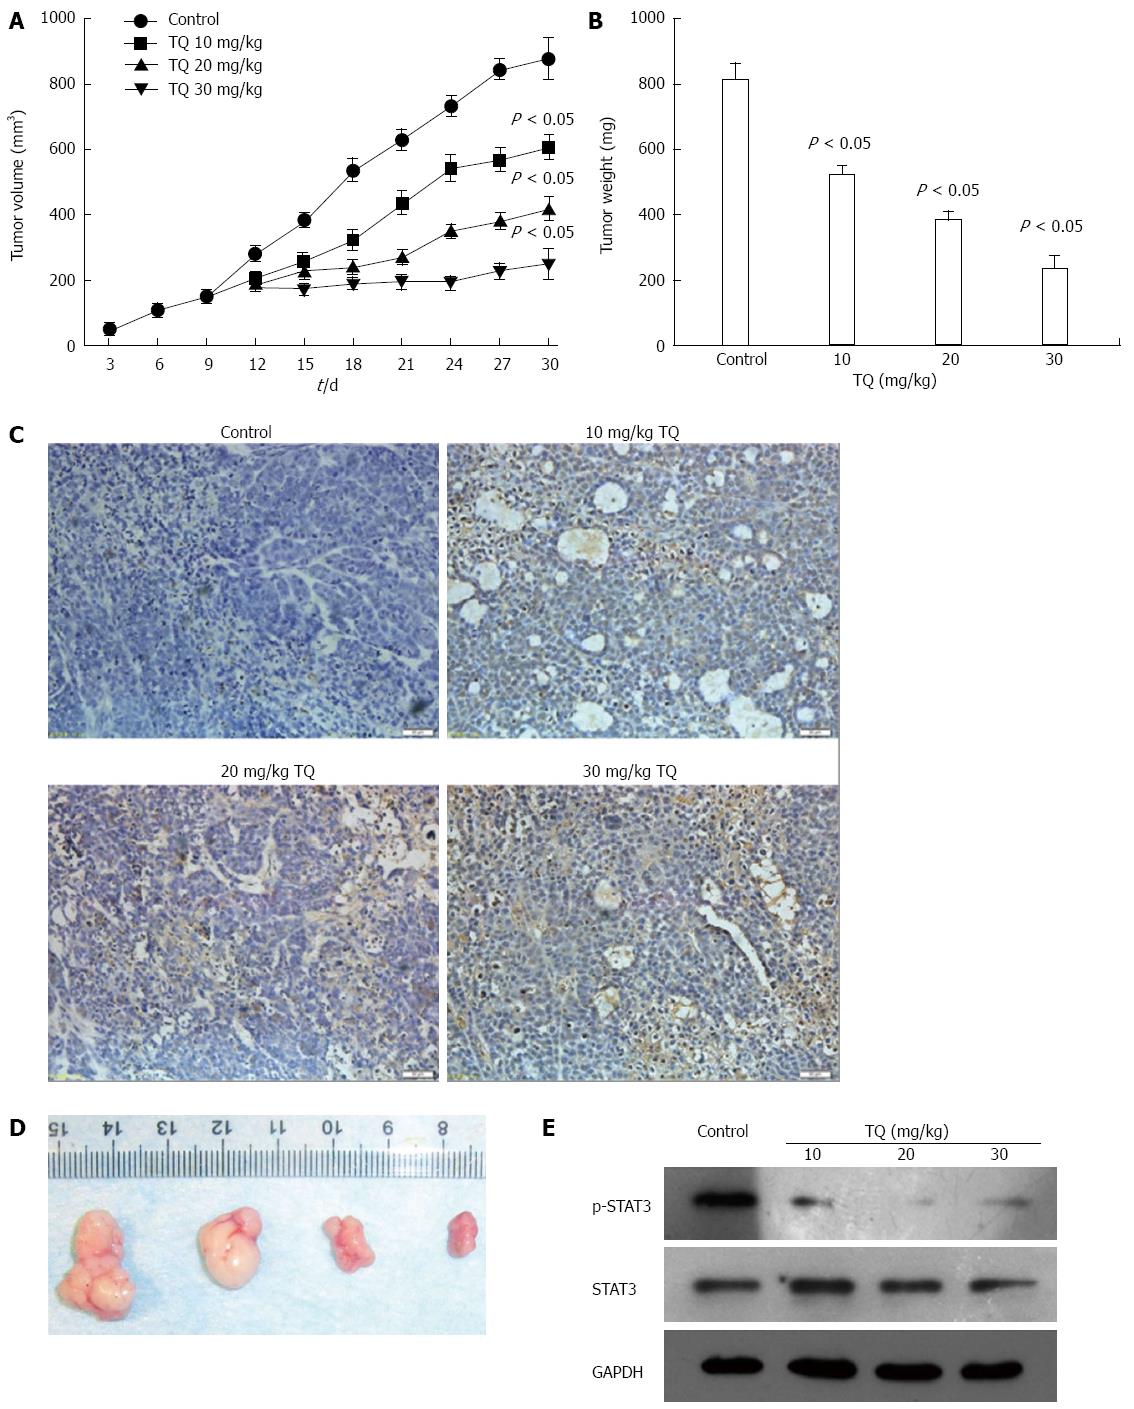
Figure 6 Thymoquinone inhibits tumor growth in a gastric mouse xenograft model.
A: Tumor volumes of the xenograft tumors derived from 0, 25, 50, or 75 μmol/L TQ group. Each time point represents the mean tumor volume for each group; B: Tumor weight was obtained at the end of the experiment. Error bars represent the standard error of the mean ± SD; C: Detection of apoptotic cells in tumor tissue by TUNEL assay. Control: equal-volume physiologic saline; Treatment group: different doses of TQ: 10 mg/kg TQ; 20 mg/kg TQ; 30 mg/kg TQ; all therapies were administered three times per week via intraperitoneal injection. The brown color indicating apoptotic signals is shown by the arrows. Scale bar represents 50 mL. Original magnification: 400 ×; D: Photographs of tumors from control and TQ treatment groups. From left to right: control group, 10 mg/kg TQ; 20 mg/kg TQ; 30 mg/kg TQ group; E: TQ suppresses phosphor-STAT3 in vivo. The tumor tissue extracts were prepared, after which Western blotting was performed. The same blots were stripped and reprobed with the GAPDH antibody to verify equal protein loading. TQ: Thymoquinone; TUNEL: TdT-mediated dUTP-biotin nick end-labeling.
- Citation: Zhu WQ, Wang J, Guo XF, Liu Z, Dong WG. Thymoquinone inhibits proliferation in gastric cancer via the STAT3 pathway in vivo and in vitro. World J Gastroenterol 2016; 22(16): 4149-4159
- URL: https://www.wjgnet.com/1007-9327/full/v22/i16/4149.htm
- DOI: https://dx.doi.org/10.3748/wjg.v22.i16.4149


