Copyright
©The Author(s) 2016.
World J Gastroenterol. Apr 28, 2016; 22(16): 4091-4108
Published online Apr 28, 2016. doi: 10.3748/wjg.v22.i16.4091
Published online Apr 28, 2016. doi: 10.3748/wjg.v22.i16.4091
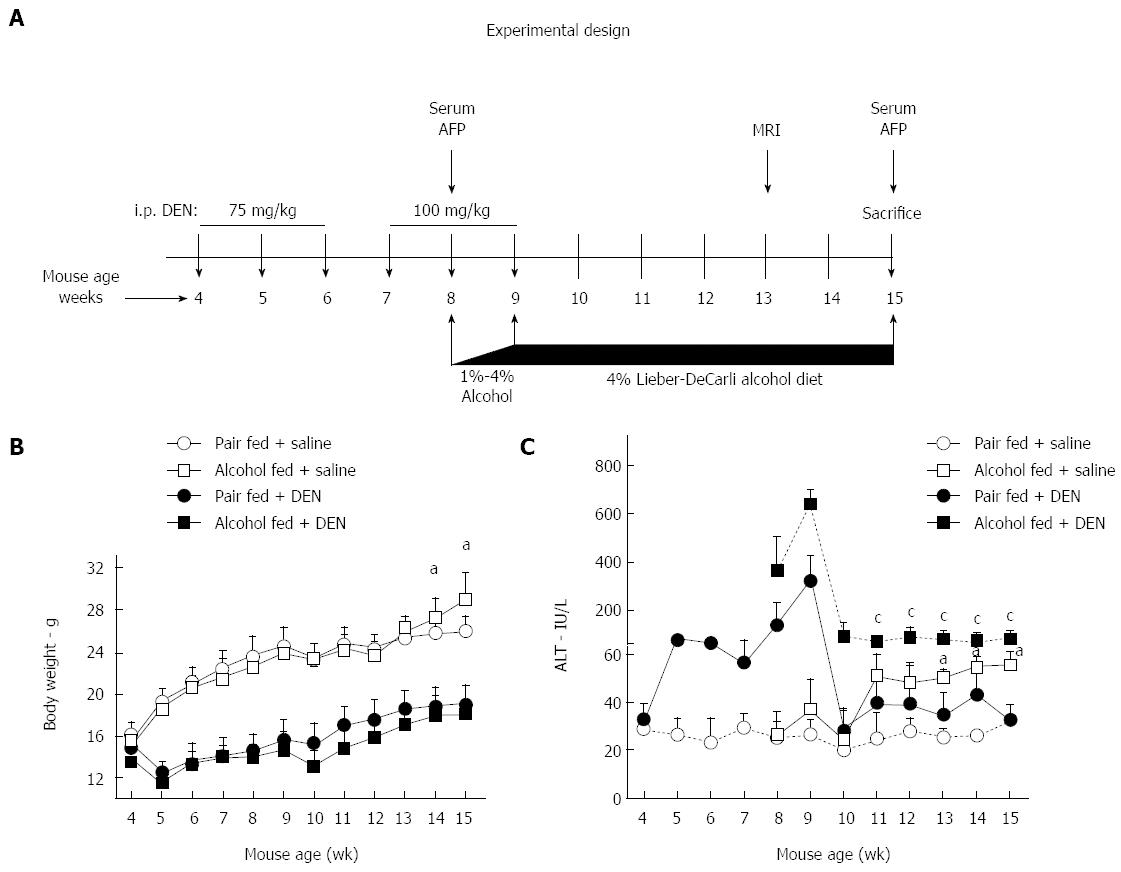
Figure 1 Chronic alcohol enhances DEN induced hepatic injury.
A: Experimental design of the adult mouse model of early hepatocellular carcinoma. B: Body weight of mice in each group per week. C: Three - five mice from each experimental group were bled every week and serum ALT was measured. The graph represents mean ALT levels of each group. In graphs B and C, values are given as mean ± SD, Dunnett’s multiple comparison were used to compare the means of multiple groups; (aP < 0.05 vs pair fed saline injected mice, cP < 0.05 vs pair fed DEN injected mice). ALT: Alanine aminotransferase; DEN: Diethyl nitrosamine; AFP: α-fetoprotein; MRI: Magnetic resonance imaging.
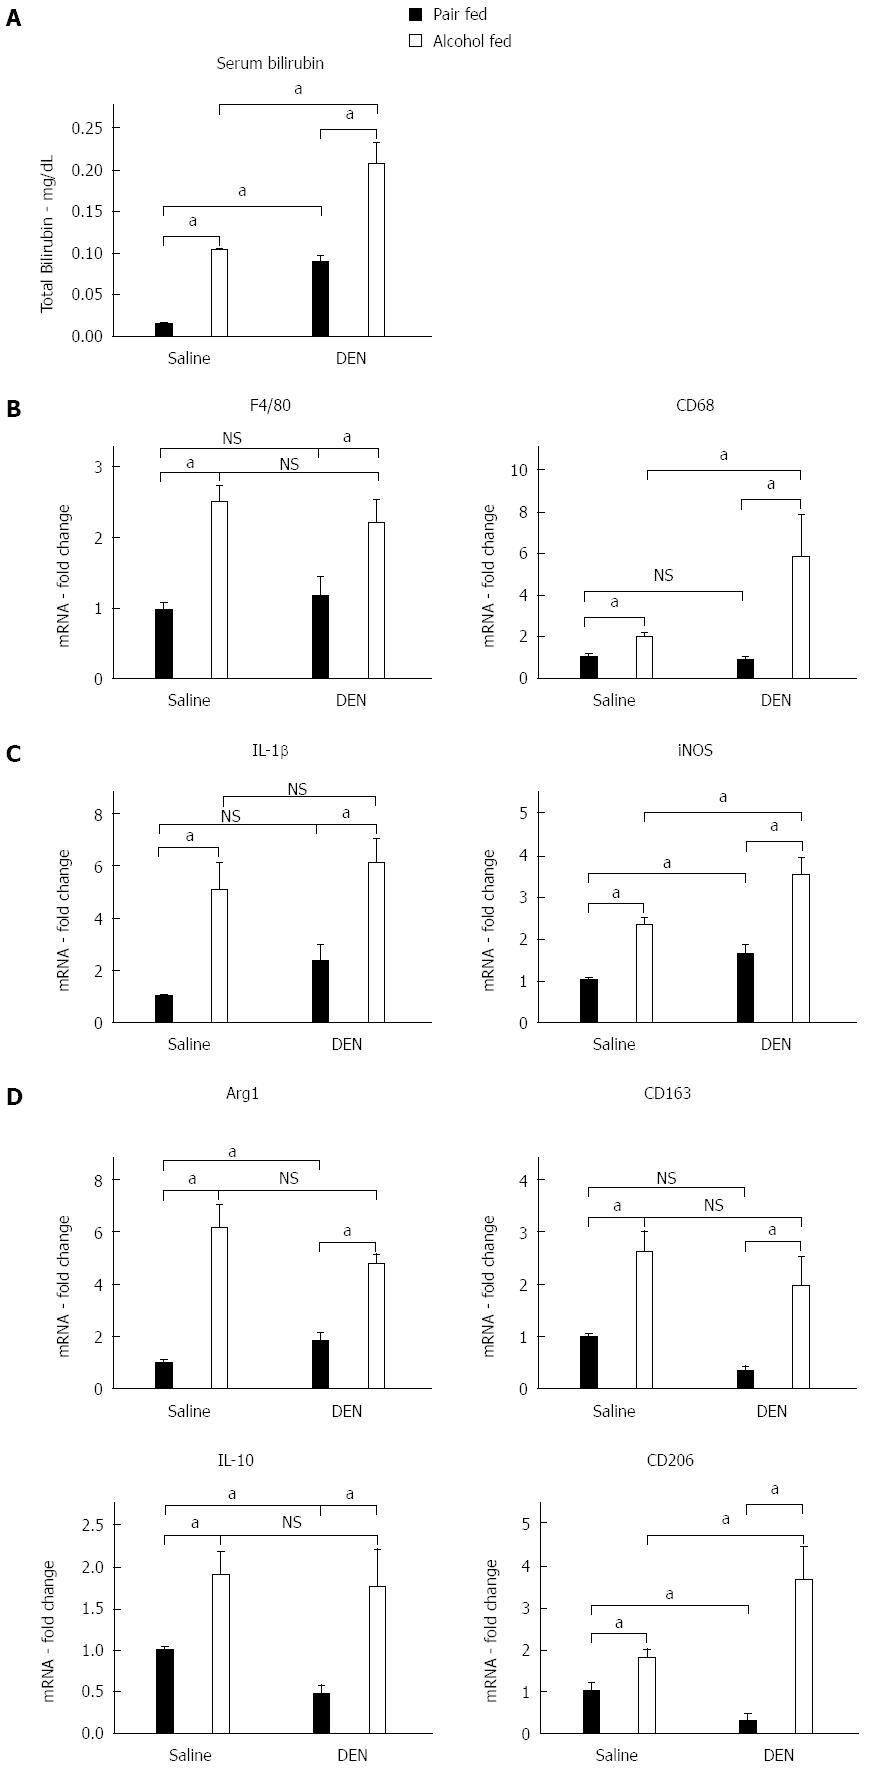
Figure 2 Alcoholic hepatitis induces macrophage polarization.
A: Serum bilirubin was measured in serum samples at week 15; B: Liver mRNA levels of macrophage markers, F4/80, CD68; C: Liver mRNA levels of M1 macrophage markers, IL-1β, iNOS; D: Liver mRNA levels of M2 macrophage markers, Arg1, CD163, IL-10, and CD206. In graphs, values are given as mean ± SD, Dunnett’s multiple comparison were used to compare the means of multiple groups; aP < 0.05. NS: Not significant; DEN: Diethyl nitrosamine; IL: Interleukin; iNOS: Inducible nitric oxide synthase.
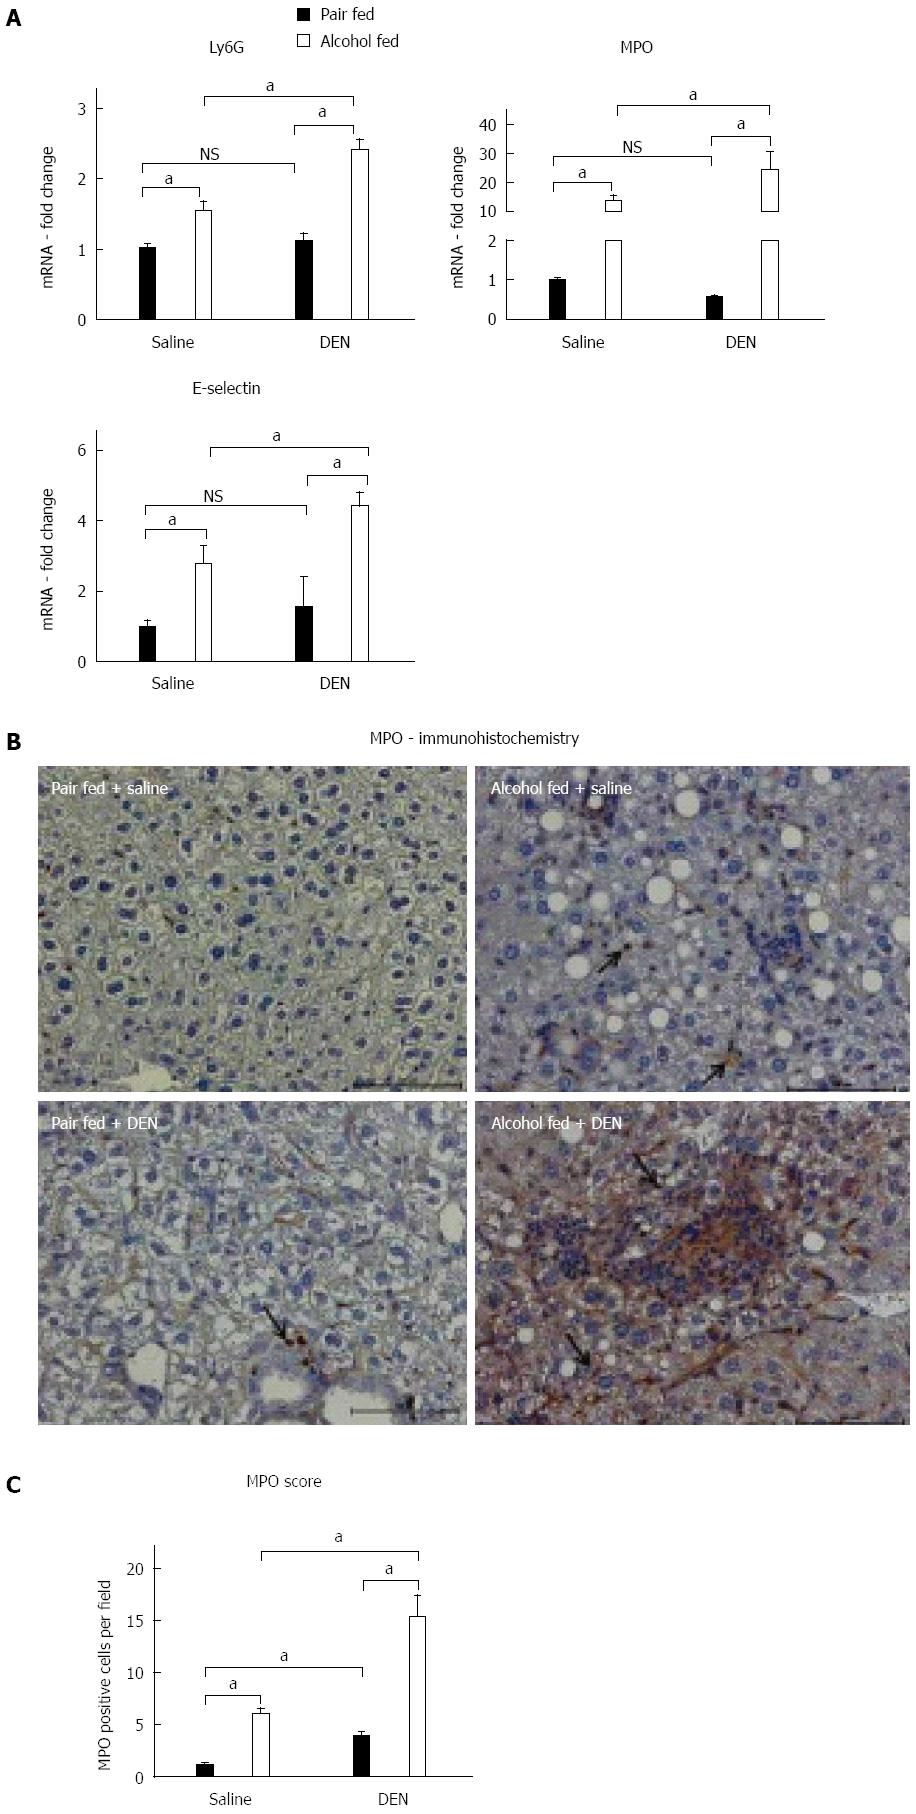
Figure 3 Alcoholic hepatitis induces neutrophil infiltration.
A: Liver mRNA levels of neutrophil markers, Ly6G, MPO and E-selectin; B: Representative myeloperoxidase (MPO) immunohistochemistry of hepatic sections (magnification × 200) from all experimental groups at 15 wk. Black arrows point to the positive staining; C: MPO positive cells were scored in at least 3 different microscopic fields for each mouse and plotted as bar graph. (n≥ 5 mice per group). In graphs, values are given as mean ± SD, Dunnett’s multiple comparison were used to compare the means of multiple groups; aP < 0.05. NS: Not significant; DEN: Diethyl nitrosamine.
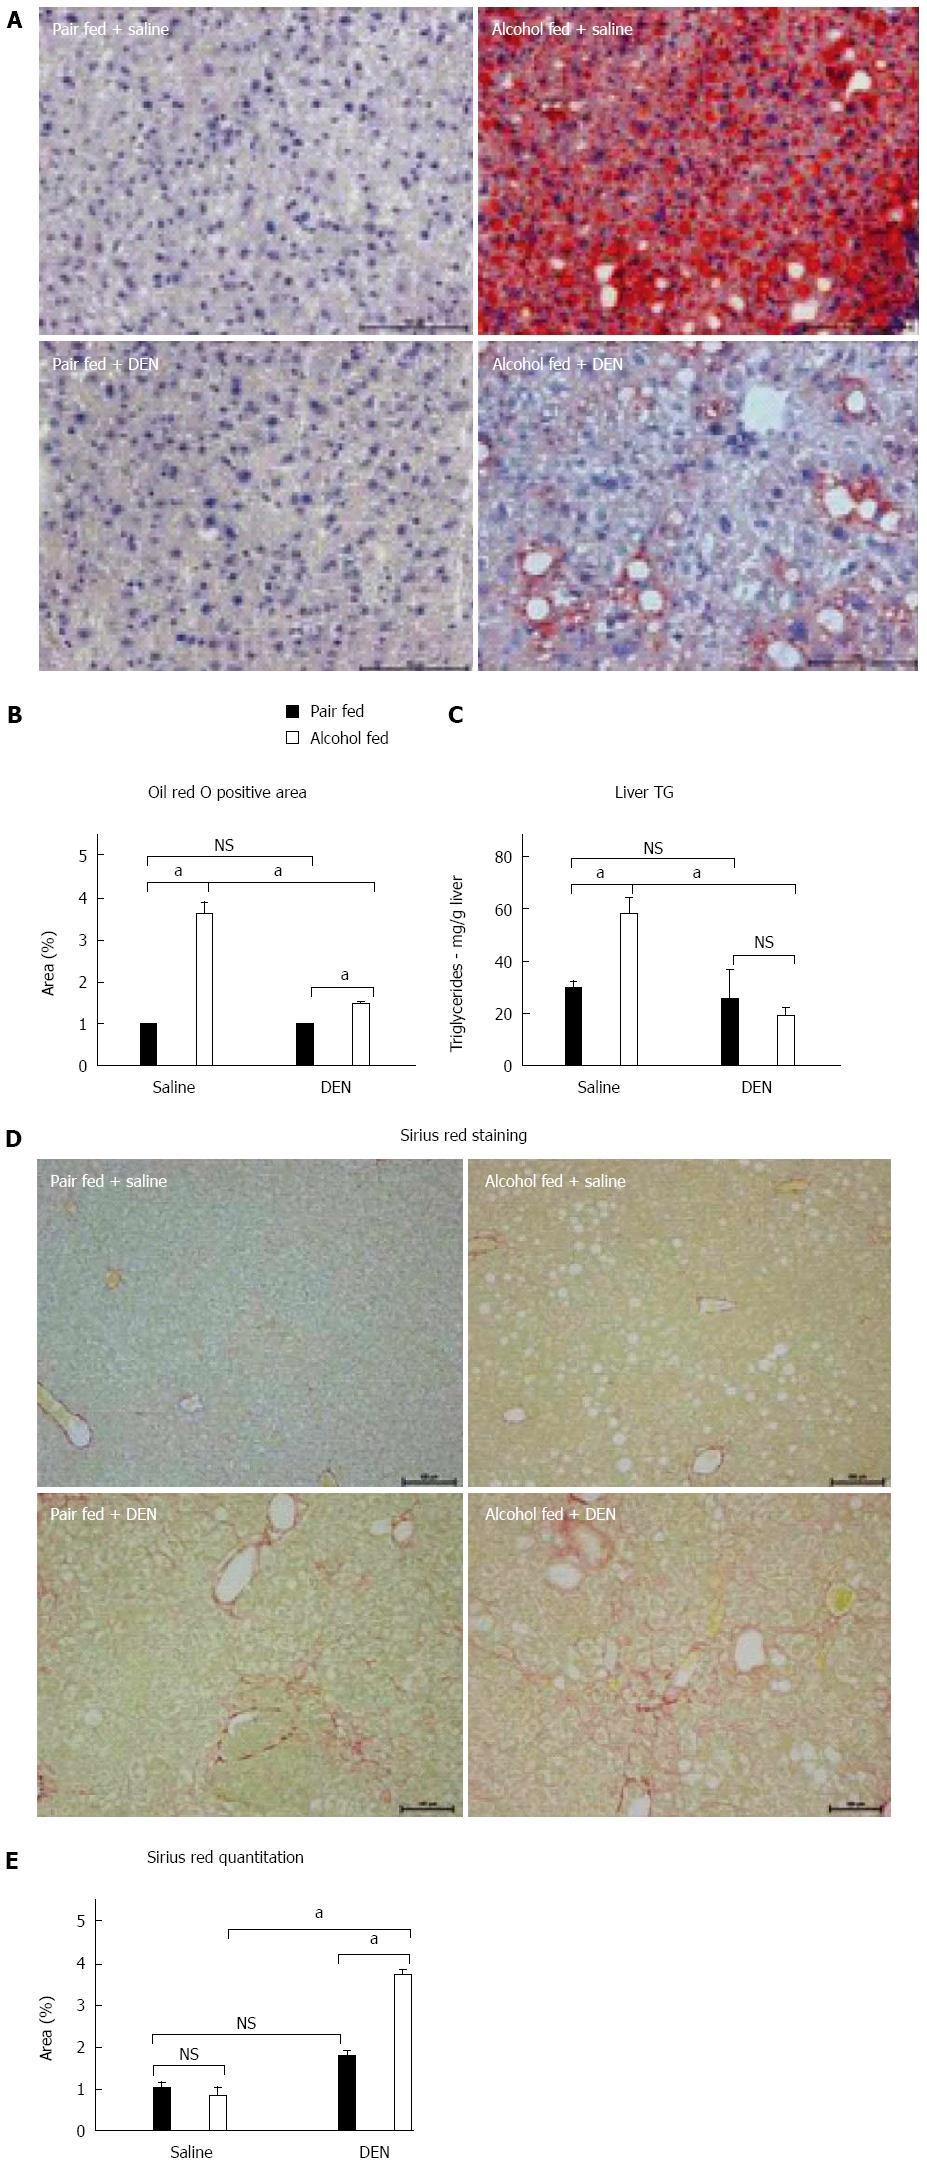
Figure 4 Chronic alcohol synergizes with diethyl nitrosamine in hepatocellular carcinoma development.
A: Representative Oil Red O staining of hepatic sections (200 × magnification) from all experimental groups at 15 wk; B: Bar graph shows percent Oil Red O stained area in groups that was quantified using ImageJ software. For quantification, at least 3 different microscope fields were scored for each mouse (n≥ 5 mice per group); C: Liver triglycerides were estimated at week 15; D: Representative Sirius Red staining of hepatic sections (magnification × 100) from all experimental groups at 15 wk. E: For quantification of fibrosis, at least 3 different microscope fields at 10x magnification were scored for each mouse (n≥ 5 mice per group). Bar graph shows percent Sirius Red positive area quantified using ImageJ. In graphs, values are given as mean ± SD, Dunnett’s multiple comparison were used to compare the means of multiple groups; aP < 0.05. NS: Not significant; DEN: Diethyl nitrosamine.
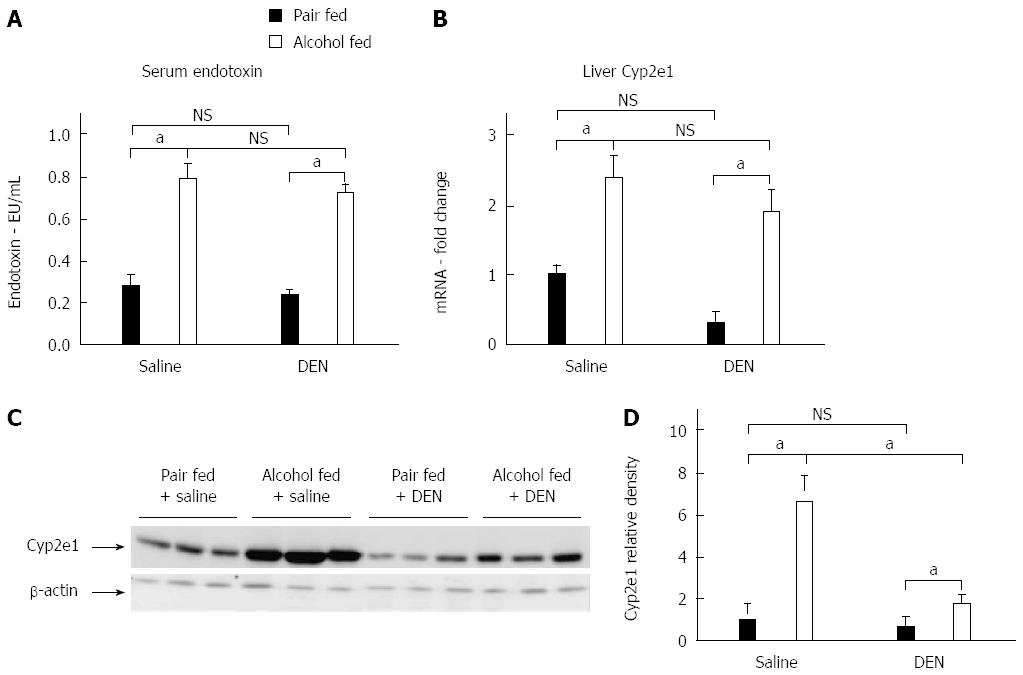
Figure 5 Chronic alcohol increases serum endotoxin levels and activates Cyp2e1.
A: Serum endotoxin; B: Liver Cyp2e1 mRNA levels; C: Representative western blot showing liver Cyp2e1 protein levels. β-actin was used as loading control for western blot; D: Relative density of Cyp2e1 western blot signal. In graphs, values are given as mean ± SD, Dunnett’s multiple comparison were used to compare the means of multiple groups; aP < 0.05. NS: Not significant; DEN: Diethyl nitrosamine.
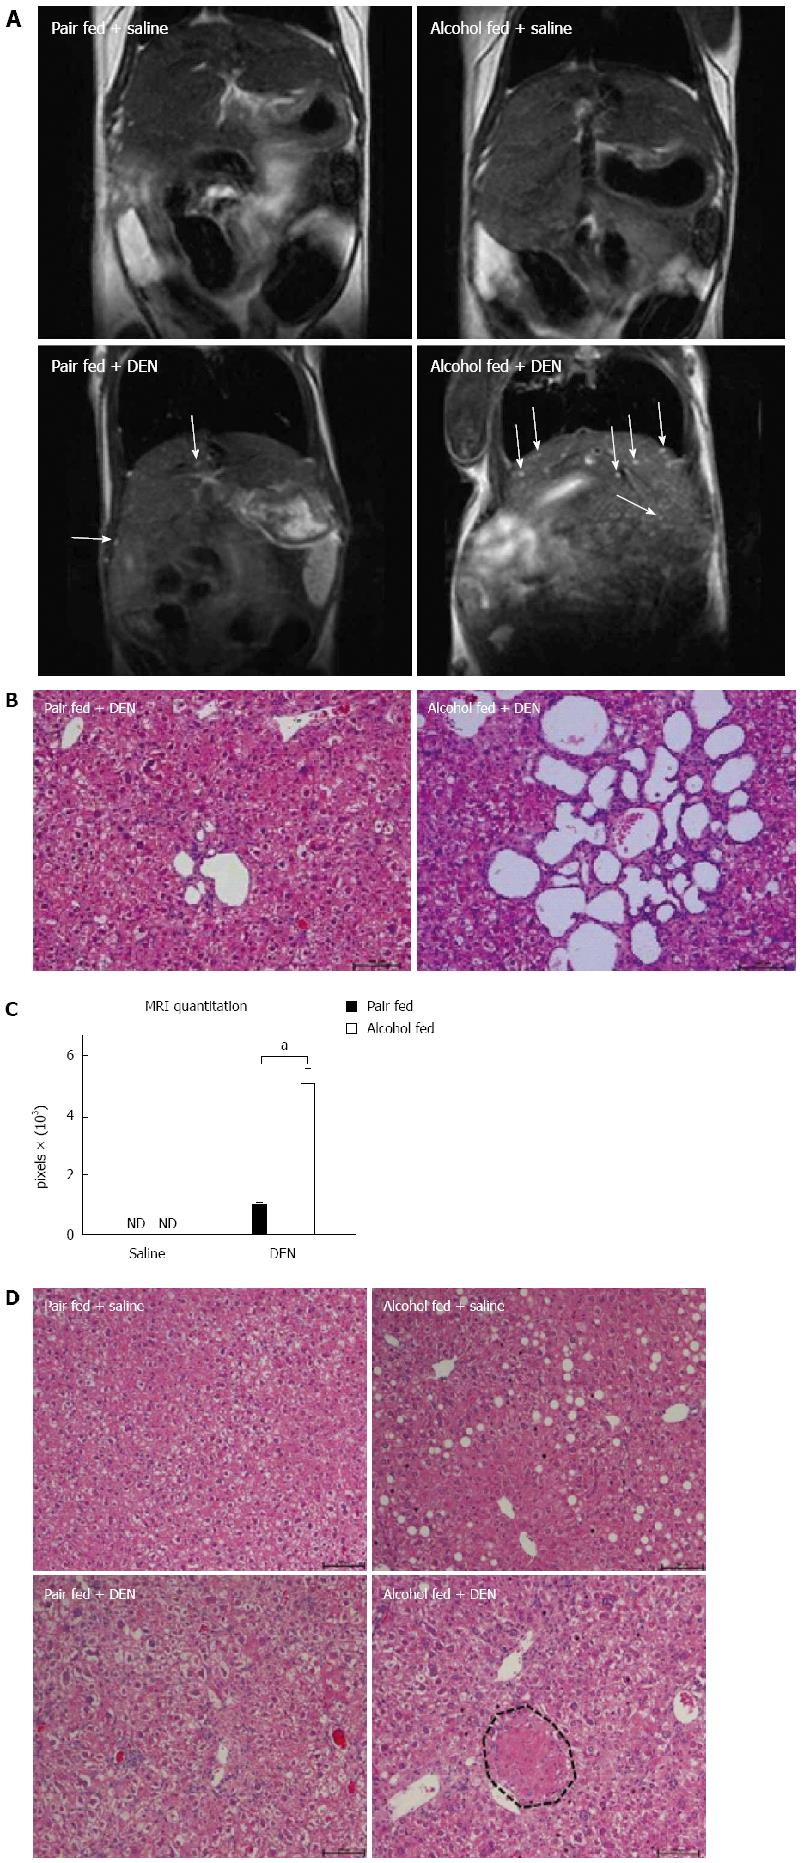
Figure 6 Chronic alcohol expedites hepatocellular carcinoma development.
A: T2-weighted MRI of liver in coronal section at week 13. Arrows denote intrahepatic cysts. B: Representative HE stained intrahepatic cysts observed in all DEN injected mice (100X magnification). Note the higher number of cysts in alcohol + DEN mice. C: Quantification of cyst area using ImageJ. D: Representative HE stained liver sections from all treatment groups (magnification × 100) at week 15. The hepatic hyperplasia (encircled in black dotted line) was exclusively observed in alcohol + DEN mice. In graph (C), values are given as mean ± SD, Dunnett’s multiple comparison were used to compare the means of multiple groups; aP < 0.05, pair fed vs alcohol fed. ND: Not detected; DEN: Diethyl nitrosamine.
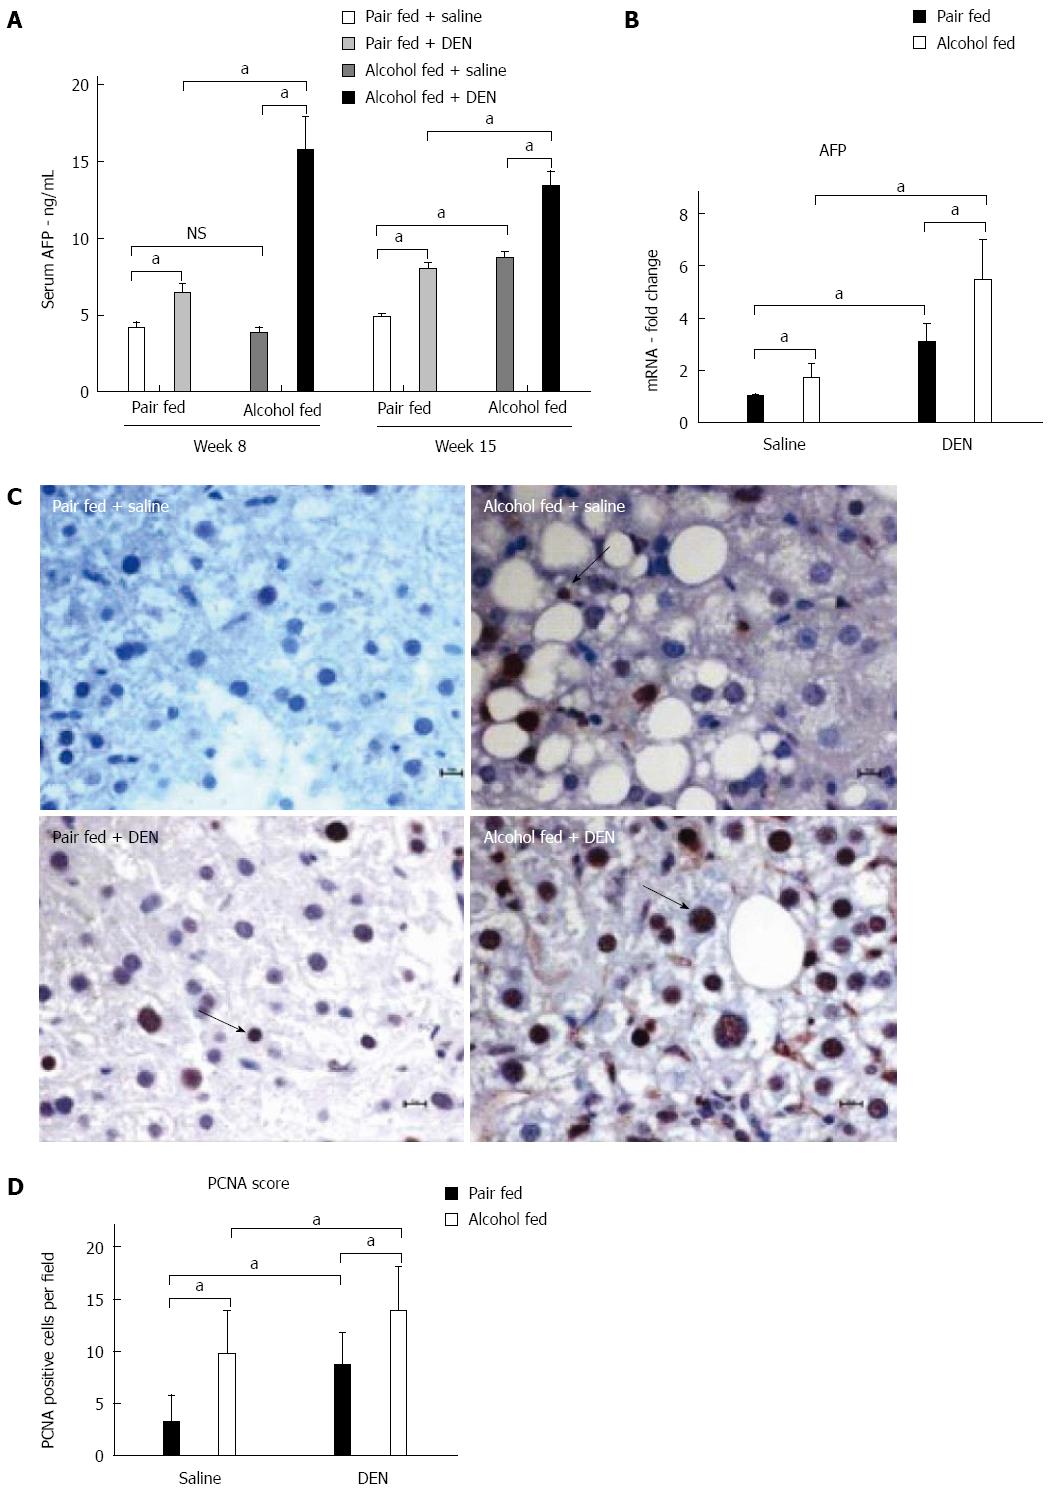
Figure 7 Chronic alcohol induces serum AFP and cellular proliferation.
A: Fold changes in serum AFP levels at week 8 and week 15; B: Liver AFP mRNA levels at week 15; C: Representative immunostaining images for proliferating cell nuclear antigen (PCNA) at week 15 (magnification × 400). Arrows point to positive staining; D: PCNA positive nuclei were scored in at least 3 different microscopic fields for each mouse and plotted as bar graph on the right. (n≥ 5 mice per group). In graphs, values are given as mean ± SD, Dunnett’s multiple comparison were used to compare the means of multiple groups; aP < 0.05. NS: Not significant; DEN: Diethyl nitrosamine; AFP: α-fetoprotein.
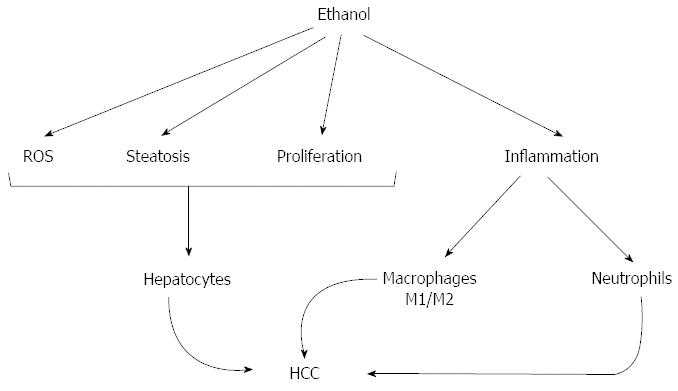
Figure 8 Multi-factorial effects of ethanol in hepatocellular carcinoma acceleration.
HCC: Hepatocellular carcinoma.
- Citation: Ambade A, Satishchandran A, Gyongyosi B, Lowe P, Szabo G. Adult mouse model of early hepatocellular carcinoma promoted by alcoholic liver disease. World J Gastroenterol 2016; 22(16): 4091-4108
- URL: https://www.wjgnet.com/1007-9327/full/v22/i16/4091.htm
- DOI: https://dx.doi.org/10.3748/wjg.v22.i16.4091


