Copyright
©The Author(s) 2016.
World J Gastroenterol. Apr 14, 2016; 22(14): 3777-3784
Published online Apr 14, 2016. doi: 10.3748/wjg.v22.i14.3777
Published online Apr 14, 2016. doi: 10.3748/wjg.v22.i14.3777
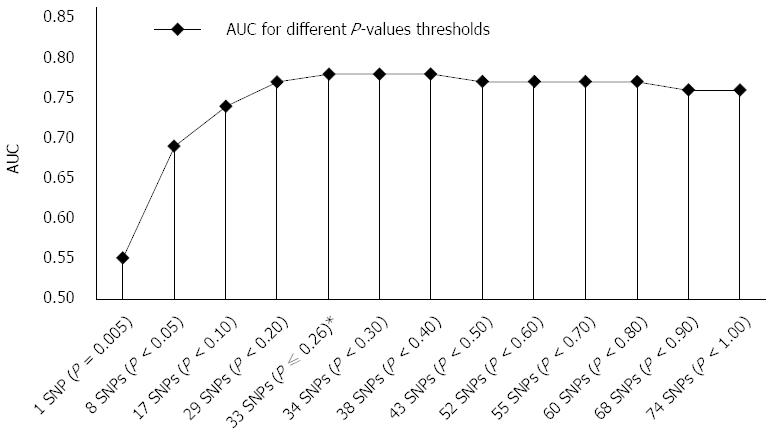
Figure 1 Area under curve for different P-values thresholds and corresponding numbers of included single nucleotide polymorphisms.
The most optimal AUC was achieved with GRS of 33 risk alleles (AUC of 0.78) at P-value threshold of 0.256 (marked with *). Adding 41 SNPs to GRS did not improve GRS significantly, however it presented needless background noise. AUC: Area under curve; GRS: Genetic risk scores; SNPs: Single nucleotide polymorphisms.
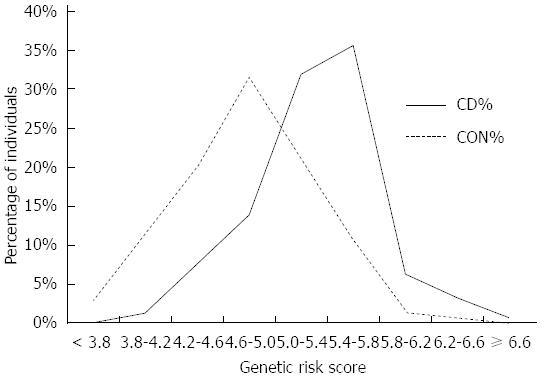
Figure 2 Distribution of Genetic risk scores in Crohn’s disease and controls.
GRS is normally distributed (Shapiro-Wilk, P > 0.05) in CD cases and controls. Cases have significantly higher GRS (5.32 ± 0.47) than controls (4.78 ± 0.53); P < 10-4. CD: Crohn’s disease; GRS: Genetic risk scores.
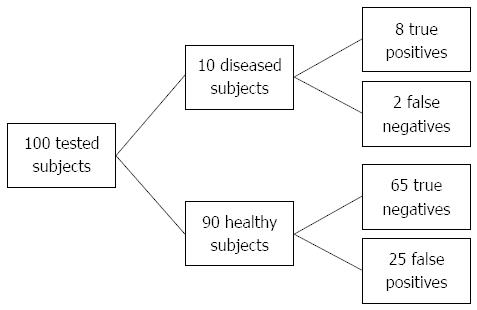
Figure 3 Flow diagram for sensitivity (75%) and specificity (72.
7%) in targeted population (Crohn’s disease prevalence 10%). If we test 100 subjects and set the cut-off at 5.05, 32 of them will test positive (above cut-off), with post-test probability of disease approximately 24% (8/33).
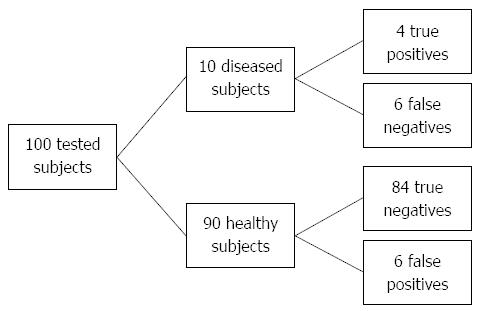
Figure 4 Flow diagram for sensitivity (35.
6%) and specificity (93.3%) in targeted population (Crohn’s disease prevalence 10%). If we test 100 subjects and set the cut-off at 5.54, 10 of them will test positive (above cut-off), with post-test probability of disease approximately 40% (4/10).
- Citation: Zupančič K, Skok K, Repnik K, Weersma RK, Potočnik U, Skok P. Multi-locus genetic risk score predicts risk for Crohn’s disease in Slovenian population. World J Gastroenterol 2016; 22(14): 3777-3784
- URL: https://www.wjgnet.com/1007-9327/full/v22/i14/3777.htm
- DOI: https://dx.doi.org/10.3748/wjg.v22.i14.3777


