Copyright
©The Author(s) 2016.
World J Gastroenterol. Apr 7, 2016; 22(13): 3621-3631
Published online Apr 7, 2016. doi: 10.3748/wjg.v22.i13.3621
Published online Apr 7, 2016. doi: 10.3748/wjg.v22.i13.3621
Figure 1 Schematic representation of the calcification patterns.
A: Without calcifications; B: With feathery calcifications; C: With focal calcifications; D: With a central calcification; E: With diffuse calcifications; F: With calcifications primarily at the edge.
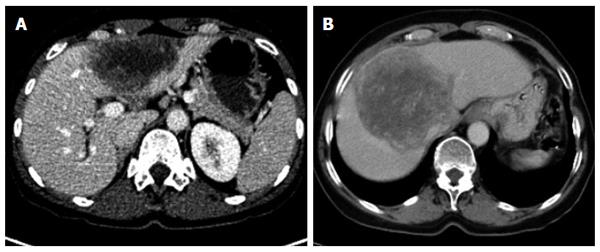
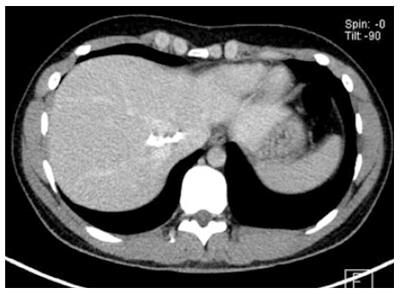
Figure 2 Diffuse infiltrating with cystoid portion (A); without cystoid portion (B).
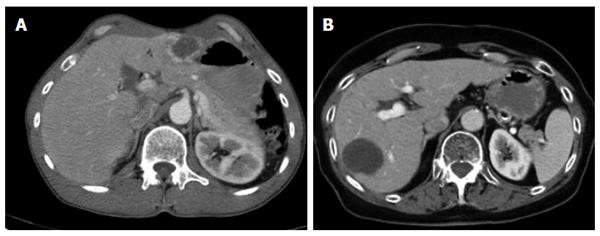
Figure 3 Primarily circumscribed tumor-like with cystoid portion (A); without cystoid portion (B).
Figure 4 Primarily cystoid - intermediate with more solid portions at the edge (A); without more solid portions at the edge (B).
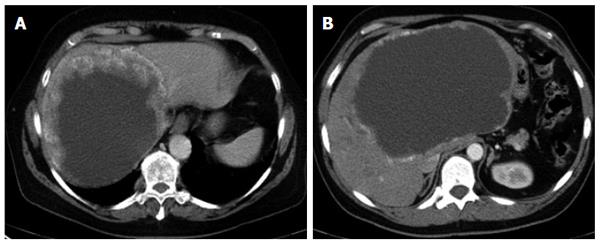
Figure 5 Primarily cystoid - widespread with more solid portions at the edge (A); without more solid portions at the edge (B).
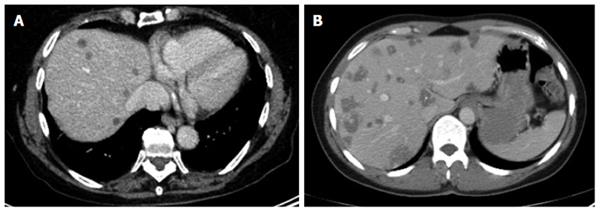
Figure 6 Small-cystoid/metastatic* (A, B): exclusive occurrence of the central calcification* (B).
Figure 7 Mainly calcified.
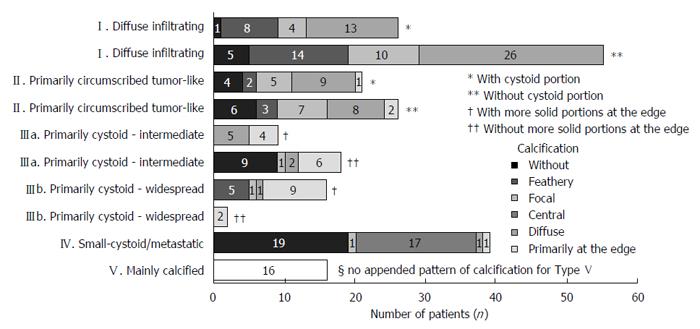
Figure 8 Frequency of primary morphologies, appended sub-criteria and individual calcification patterns, respectively.
- Citation: Graeter T, Kratzer W, Oeztuerk S, Haenle MM, Mason RA, Hillenbrand A, Kull T, Barth TF, Kern P, Gruener B. Proposal of a computed tomography classification for hepatic alveolar echinococcosis. World J Gastroenterol 2016; 22(13): 3621-3631
- URL: https://www.wjgnet.com/1007-9327/full/v22/i13/3621.htm
- DOI: https://dx.doi.org/10.3748/wjg.v22.i13.3621


