Copyright
©The Author(s) 2016.
World J Gastroenterol. Apr 7, 2016; 22(13): 3581-3591
Published online Apr 7, 2016. doi: 10.3748/wjg.v22.i13.3581
Published online Apr 7, 2016. doi: 10.3748/wjg.v22.i13.3581
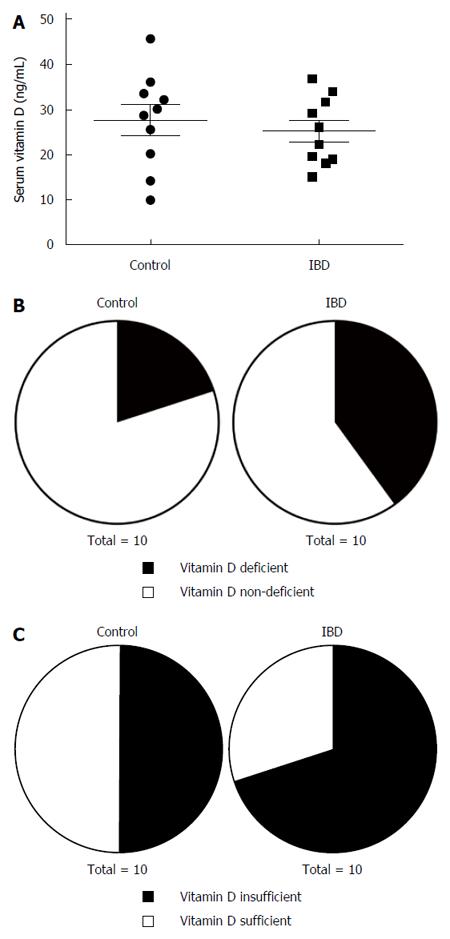
Figure 1 Vitamin D status in control patients and patients with inflammatory bowel disease.
A: Serum levels of 25-hydroxyvitamin D3 in control and inflammatory bowel disease (IBD) patients (n = 10 patients/group). B: Proportion of control and IBD patients with vitamin D deficiency (< 20 ng/mL). C: Proportion of control and IBD patients with vitamin D insufficiency (< 30 ng/mL).
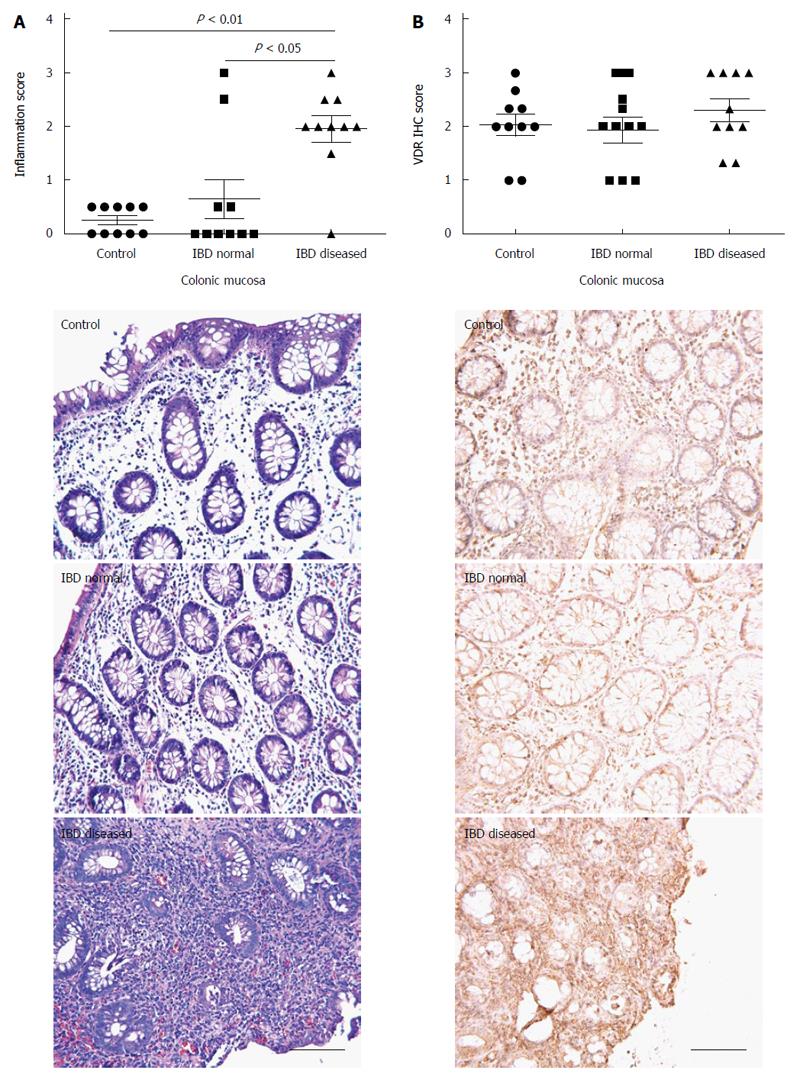
Figure 2 Colonic inflammatory and vitamin D receptor status in control and inflammatory bowel disease patients.
Inflammation score (A) and VDR expression (B) for colonic mucosa from control patients, normal appearing mucosa from IBD patients, and visually diseased mucosa from IBD patients (n = 10 per group). Each IBD patient contributed a biopsy from normal appearing mucosa and another biopsy from visually diseased mucosa. VDR: Vitamin D receptor; IBD: Inflammatory bowel disease.
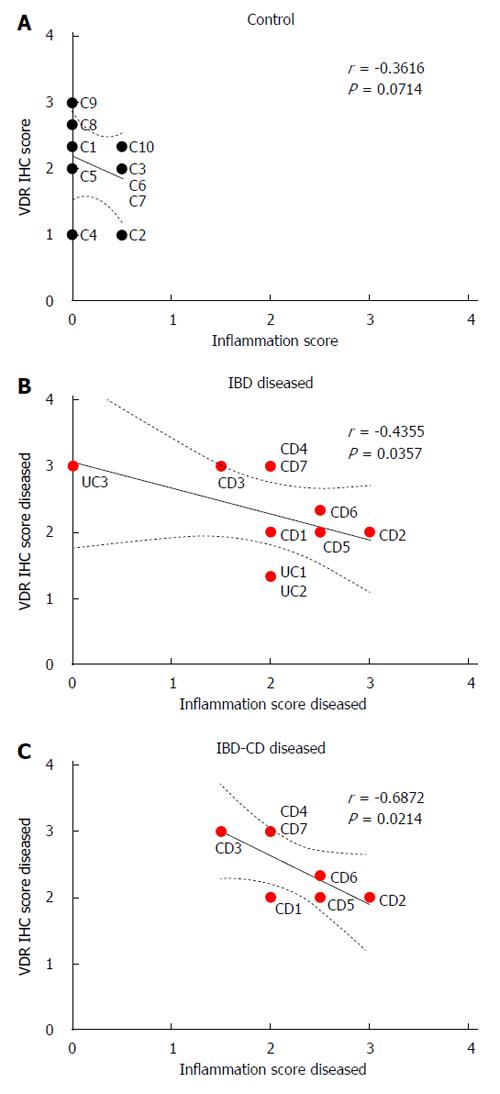
Figure 3 Correlation between inflammation and vitamin D receptor.
Immunohistochemistry (IHC) scores for vitamin D receptor and inflammation scores in colonic mucosa from control patients (A), inflammatory bowel disease (IBD) patients (B), and patients with Crohn’s disease (CD) (C). In B and C, inflammation and VDR scores from visually diseased mucosa were used for IBD and CD patients (red circles).
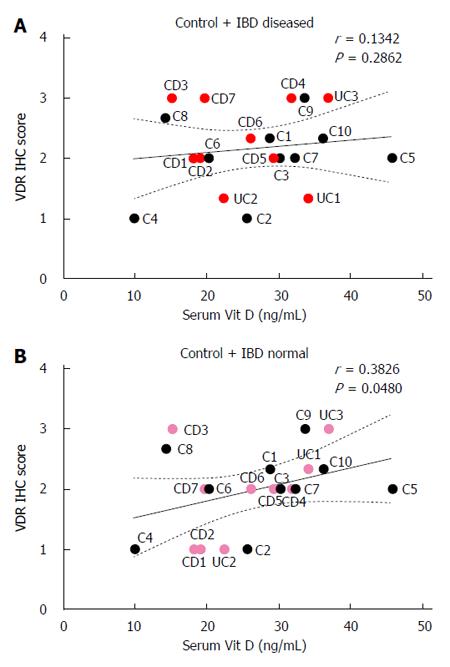
Figure 4 Correlation between serum 25-hydroxyvitamin D3 levels and vitamin D receptor immunohistochemistry scores in control and inflammatory bowel disease patients.
A: VDR scores from visually diseased mucosa were used for IBD patients (red circles); B: VDR scores from normal appearing mucosa were used for IBD patients (pink circles). VDR: Vitamin D receptor; CD: Crohn’s disease; UC: Ulcerative colitis; IBD: Inflammatory bowel disease; IHC: Immunohistochemistry.
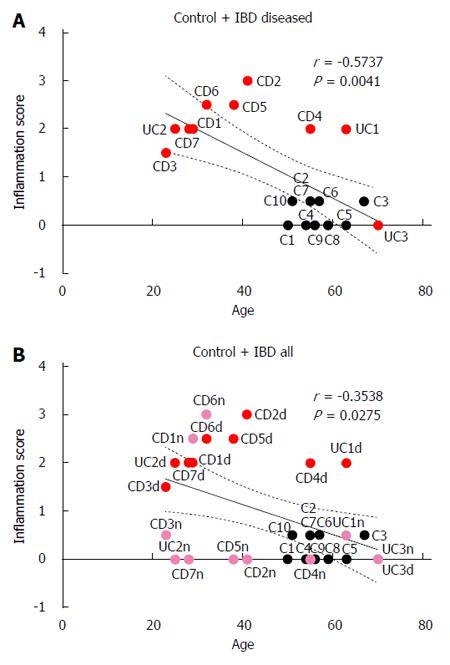
Figure 5 Correlation between age and inflammation scores for control and inflammatory bowel disease patients.
A: inflammation scores from visually diseased mucosa were used for IBD patients (red circles); B: inflammation scores from both normal appearing mucosa (pink circles) and visually diseased mucosa (red circles) were used for IBD patients. CD: Crohn’s disease; UC: Ulcerative colitis; IBD: Inflammatory bowel disease.
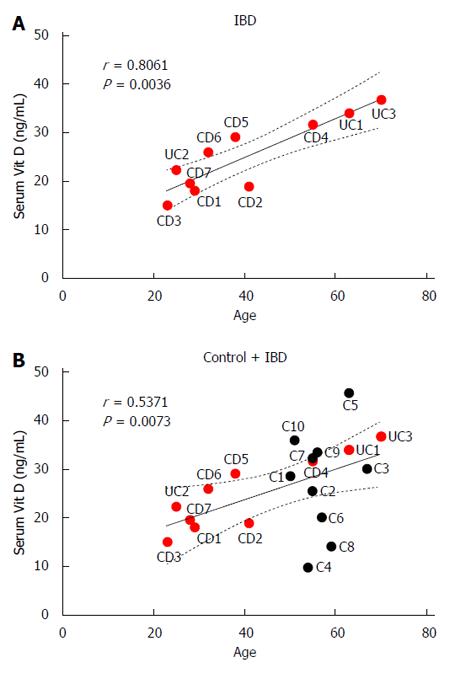
Figure 6 Correlation between age and serum 25-hydroxyvitamin D3 levels for inflammatory bowel disease patients (A) and all patients (B).
- Citation: Abreu-Delgado Y, Isidro RA, Torres EA, González A, Cruz ML, Isidro AA, González-Keelan CI, Medero P, Appleyard CB. Serum vitamin D and colonic vitamin D receptor in inflammatory bowel disease. World J Gastroenterol 2016; 22(13): 3581-3591
- URL: https://www.wjgnet.com/1007-9327/full/v22/i13/3581.htm
- DOI: https://dx.doi.org/10.3748/wjg.v22.i13.3581


