Copyright
©The Author(s) 2016.
World J Gastroenterol. Mar 28, 2016; 22(12): 3486-3495
Published online Mar 28, 2016. doi: 10.3748/wjg.v22.i12.3486
Published online Mar 28, 2016. doi: 10.3748/wjg.v22.i12.3486
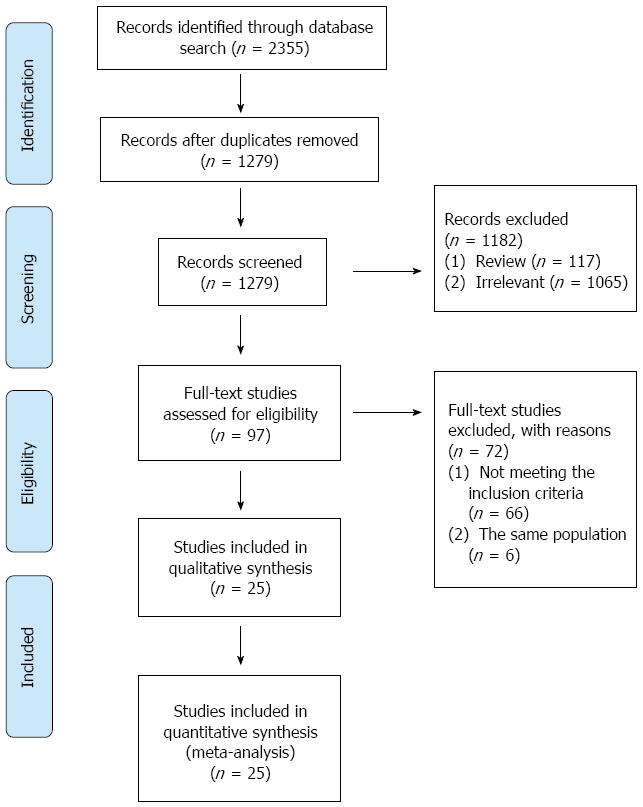
Figure 1 Study flow diagram.
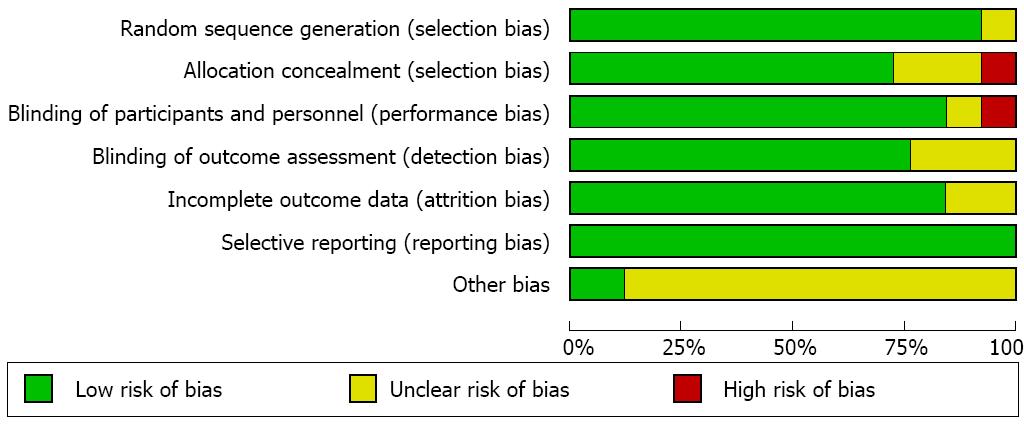
Figure 2 Risk of bias graph.
The Cochrane collaboration’s tool was used to evaluate risk of bias.
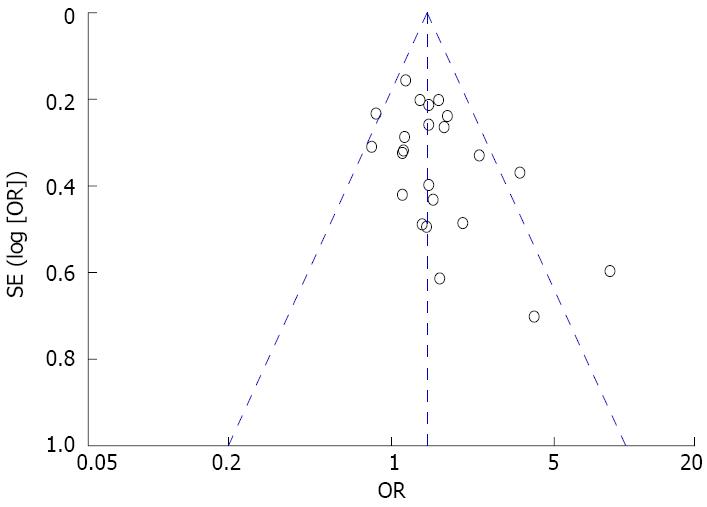
Figure 3 Funnel plot of included studies for potential publication bias.
The funnel plot was not absolutely symmetrical.
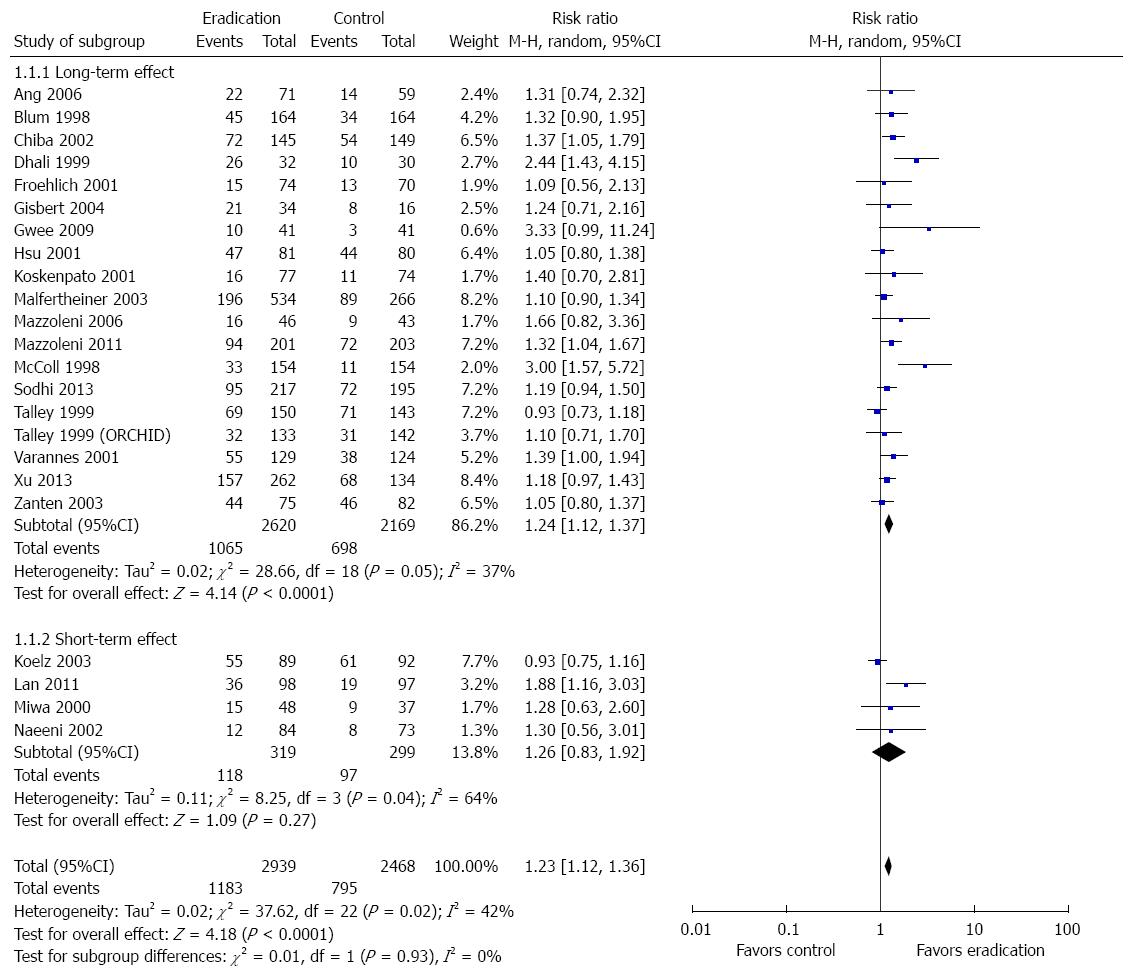
Figure 4 Forest plot of the effects comparing Helicobacter pylori eradication therapy vs control on symptom relief.
Twenty-three studies were included. The random effect model (Mantel-Haenszel method) was applied.
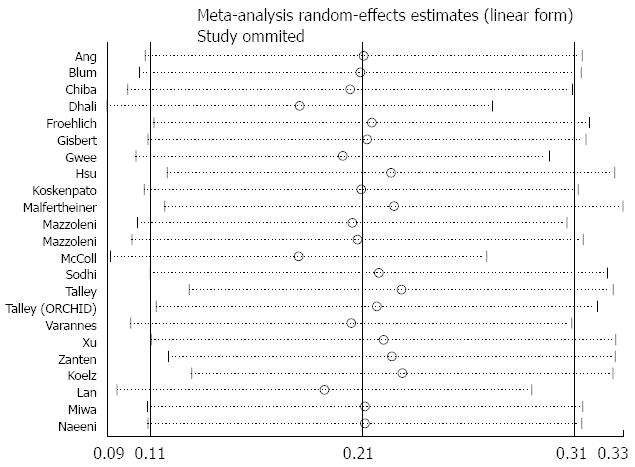
Figure 5 Sensitivity analysis of the effects comparing Helicobacter pylori eradication therapy vs control on symptom relief.
Figure 6 Forest plot of the effects comparing Helicobacter pylori eradication therapy vs control on quality of life.
Seven studies were included. The fixed effect model (Inverse Variance method) was applied.
Figure 7 Forest plot of the effects comparing Helicobacter pylori eradication therapy vs control on long-term peptic ulceration.
Six studies were included. The fixed effect (Inverse Variance method) model was applied.
Figure 8 Forest plot of the effects comparing Helicobacter pylori eradication therapy vs control on adverse events.
Eight studies were included. The random effect model (Mantel-Haenszel method) was applied.
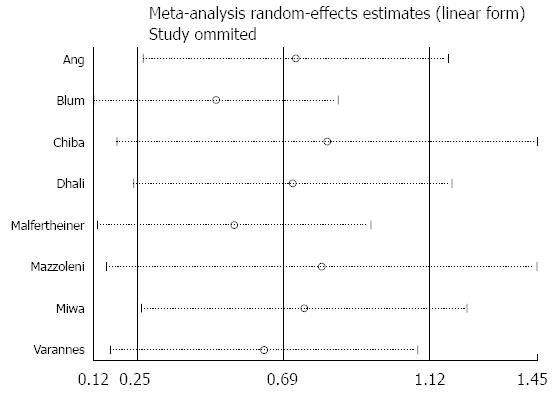
Figure 9 Sensitivity analysis of the effects comparing Helicobacter pylori eradication therapy vs control on adverse events.
Figure 10 Forest plot of the effects comparing Helicobacter pylori eradication therapy vs control on histologic resolution of chronic gastritis.
Six studies were included. The random effect model (Mantel-Haenszel method) was applied.
- Citation: Du LJ, Chen BR, Kim JJ, Kim S, Shen JH, Dai N. Helicobacter pylori eradication therapy for functional dyspepsia: Systematic review and meta-analysis. World J Gastroenterol 2016; 22(12): 3486-3495
- URL: https://www.wjgnet.com/1007-9327/full/v22/i12/3486.htm
- DOI: https://dx.doi.org/10.3748/wjg.v22.i12.3486


