Copyright
©The Author(s) 2016.
World J Gastroenterol. Mar 28, 2016; 22(12): 3451-3459
Published online Mar 28, 2016. doi: 10.3748/wjg.v22.i12.3451
Published online Mar 28, 2016. doi: 10.3748/wjg.v22.i12.3451
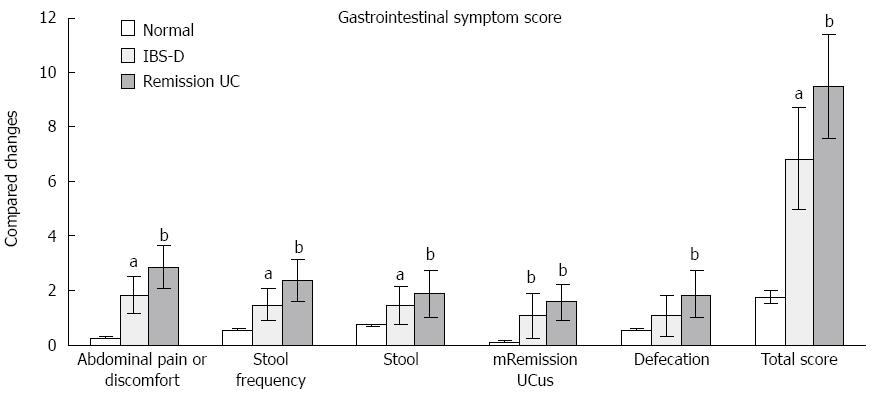
Figure 1 Changes in gastrointestinal symptom scores in each group.
aP < 0.05, bP < 0.01 vs normal. UC: Ulcerative colitis; IBS-D: Diarrhea-predominant irritable bowel syndrome.
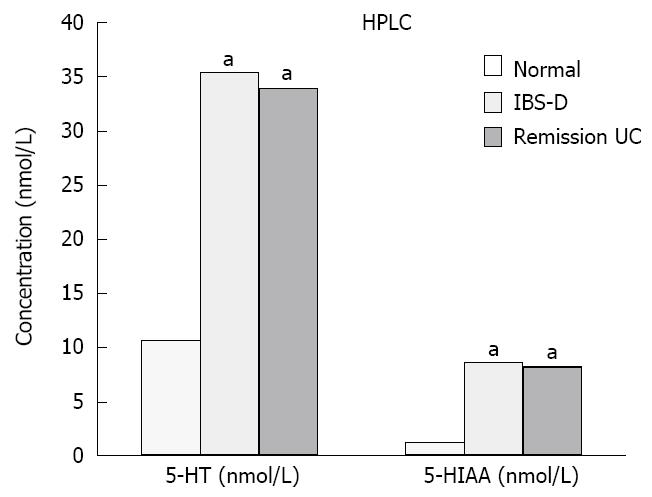
Figure 2 Comparison of 5-HT and 5-HIAA concentrations in each group.
aP < 0.05 vs normal. UC: Ulcerative colitis; IBS-D: Diarrhea-predominant irritable bowel syndrome.
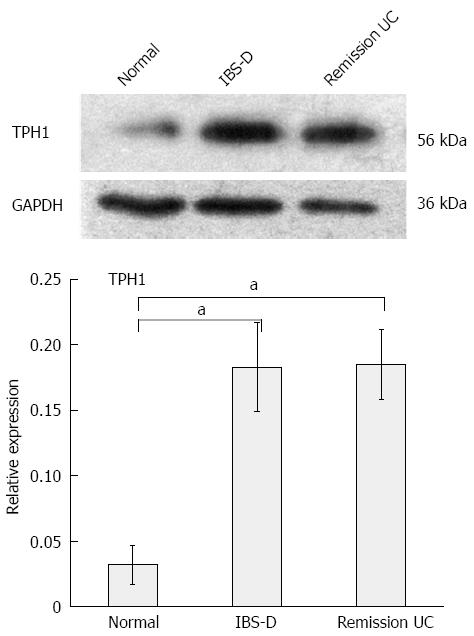
Figure 3 TPH1 protein expression in the colonic mucosa of patients from each group.
aP < 0.05 vs normal. UC: Ulcerative colitis; IBS-D: Diarrhea-predominant irritable bowel syndrome.
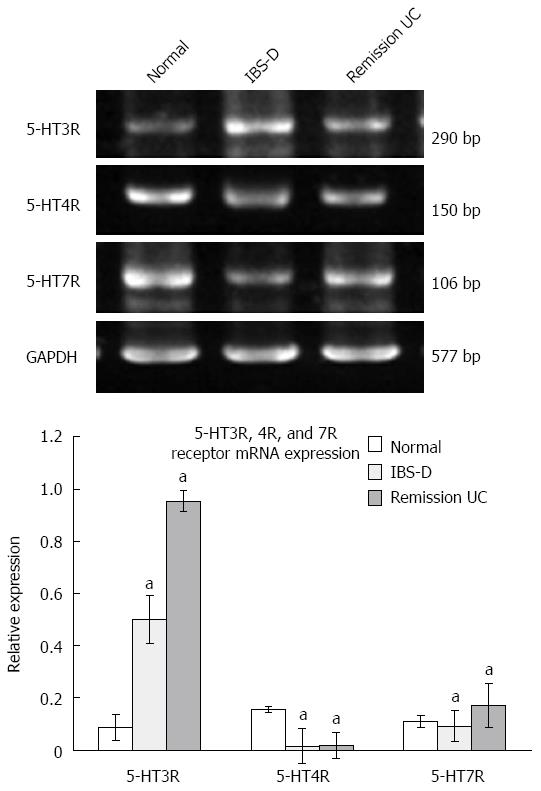
Figure 4 5-HT3R, 4R, and 7R receptor mRNA expression in each group.
aP < 0.05 vs normal. UC: Ulcerative colitis; IBS-D: Diarrhea-predominant irritable bowel syndrome.
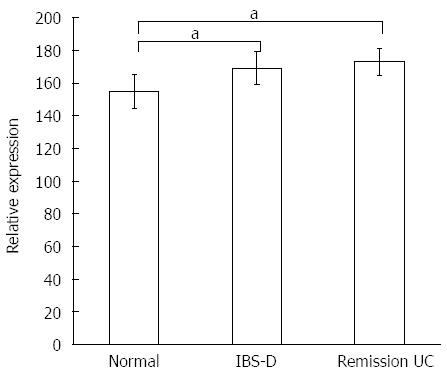
Figure 5 Comparison of serotonin transporter protein gray values.
aP < 0.05 vs normal. UC: Ulcerative colitis; IBS-D: Diarrhea-predominant irritable bowel syndrome.
- Citation: Yu FY, Huang SG, Zhang HY, Ye H, Chi HG, Zou Y, Lv RX, Zheng XB. Comparison of 5-hydroxytryptophan signaling pathway characteristics in diarrhea-predominant irritable bowel syndrome and ulcerative colitis. World J Gastroenterol 2016; 22(12): 3451-3459
- URL: https://www.wjgnet.com/1007-9327/full/v22/i12/3451.htm
- DOI: https://dx.doi.org/10.3748/wjg.v22.i12.3451


