Copyright
©The Author(s) 2016.
World J Gastroenterol. Mar 14, 2016; 22(10): 3038-3051
Published online Mar 14, 2016. doi: 10.3748/wjg.v22.i10.3038
Published online Mar 14, 2016. doi: 10.3748/wjg.v22.i10.3038
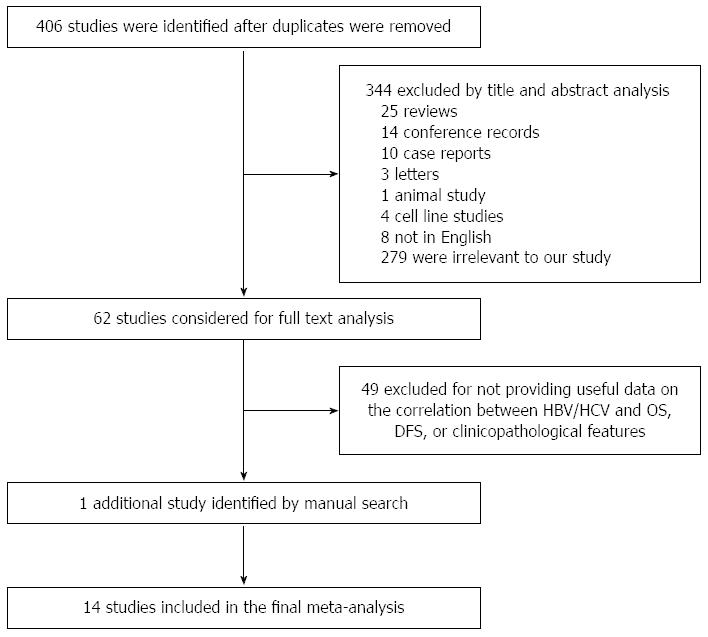
Figure 1 Flowchart of the literature search strategy.
HBV: Hepatitis B virus; HCV: Hepatitis C virus; OS: Overall survival; DFS: Disease-free survival.
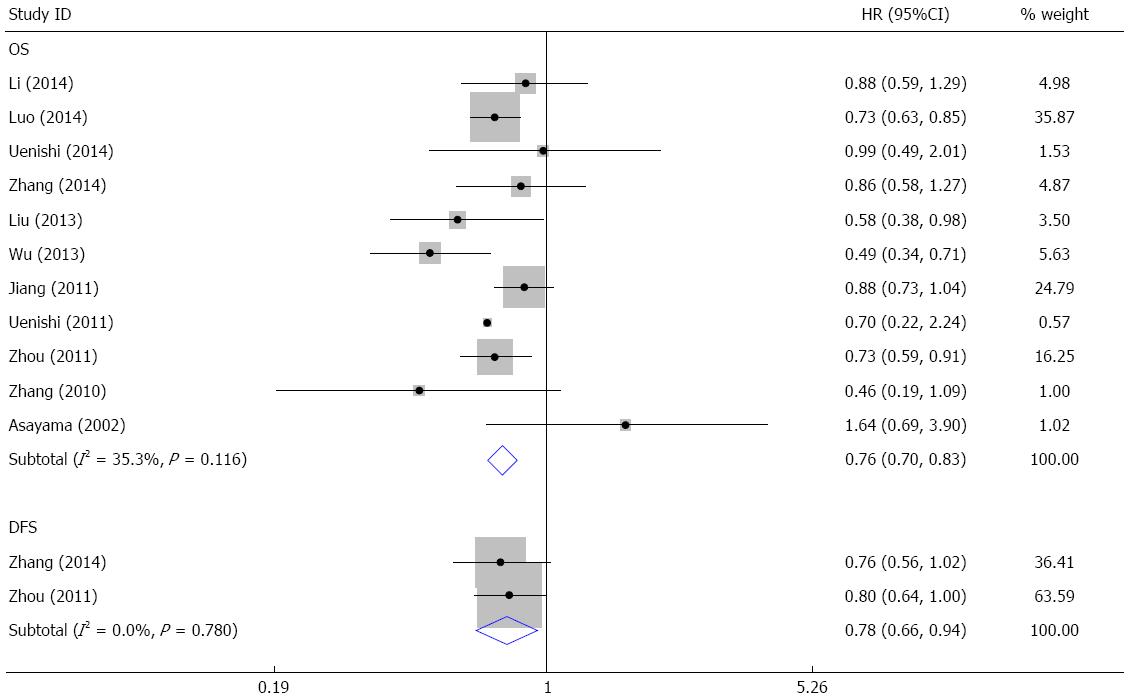
Figure 2 Forest plot of the hazard ratio for the association of hepatitis B virus infection and survival.
The survival data are reported as overall survival and disease-free survival.
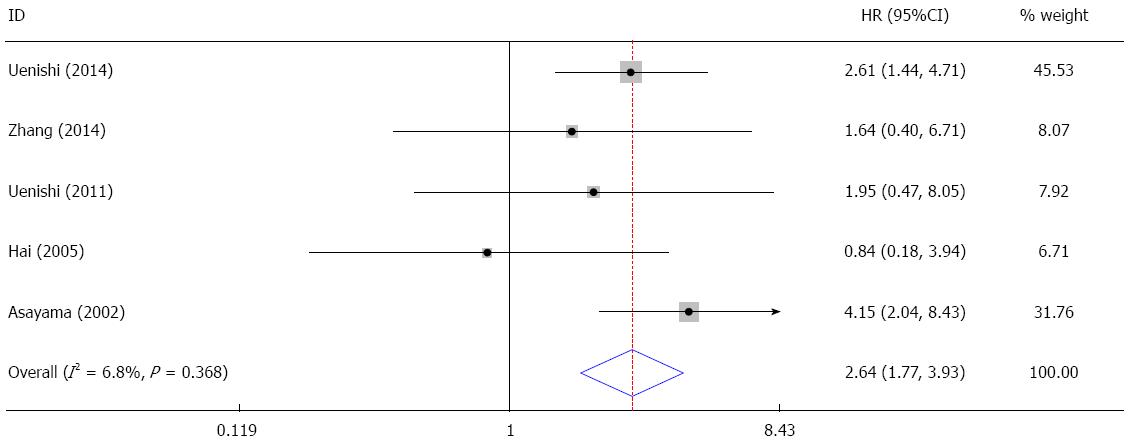
Figure 3 Forest plot of the hazard ratio for the association between hepatitis C virus infection and survival.
The prognostic information is reported as overall survival.
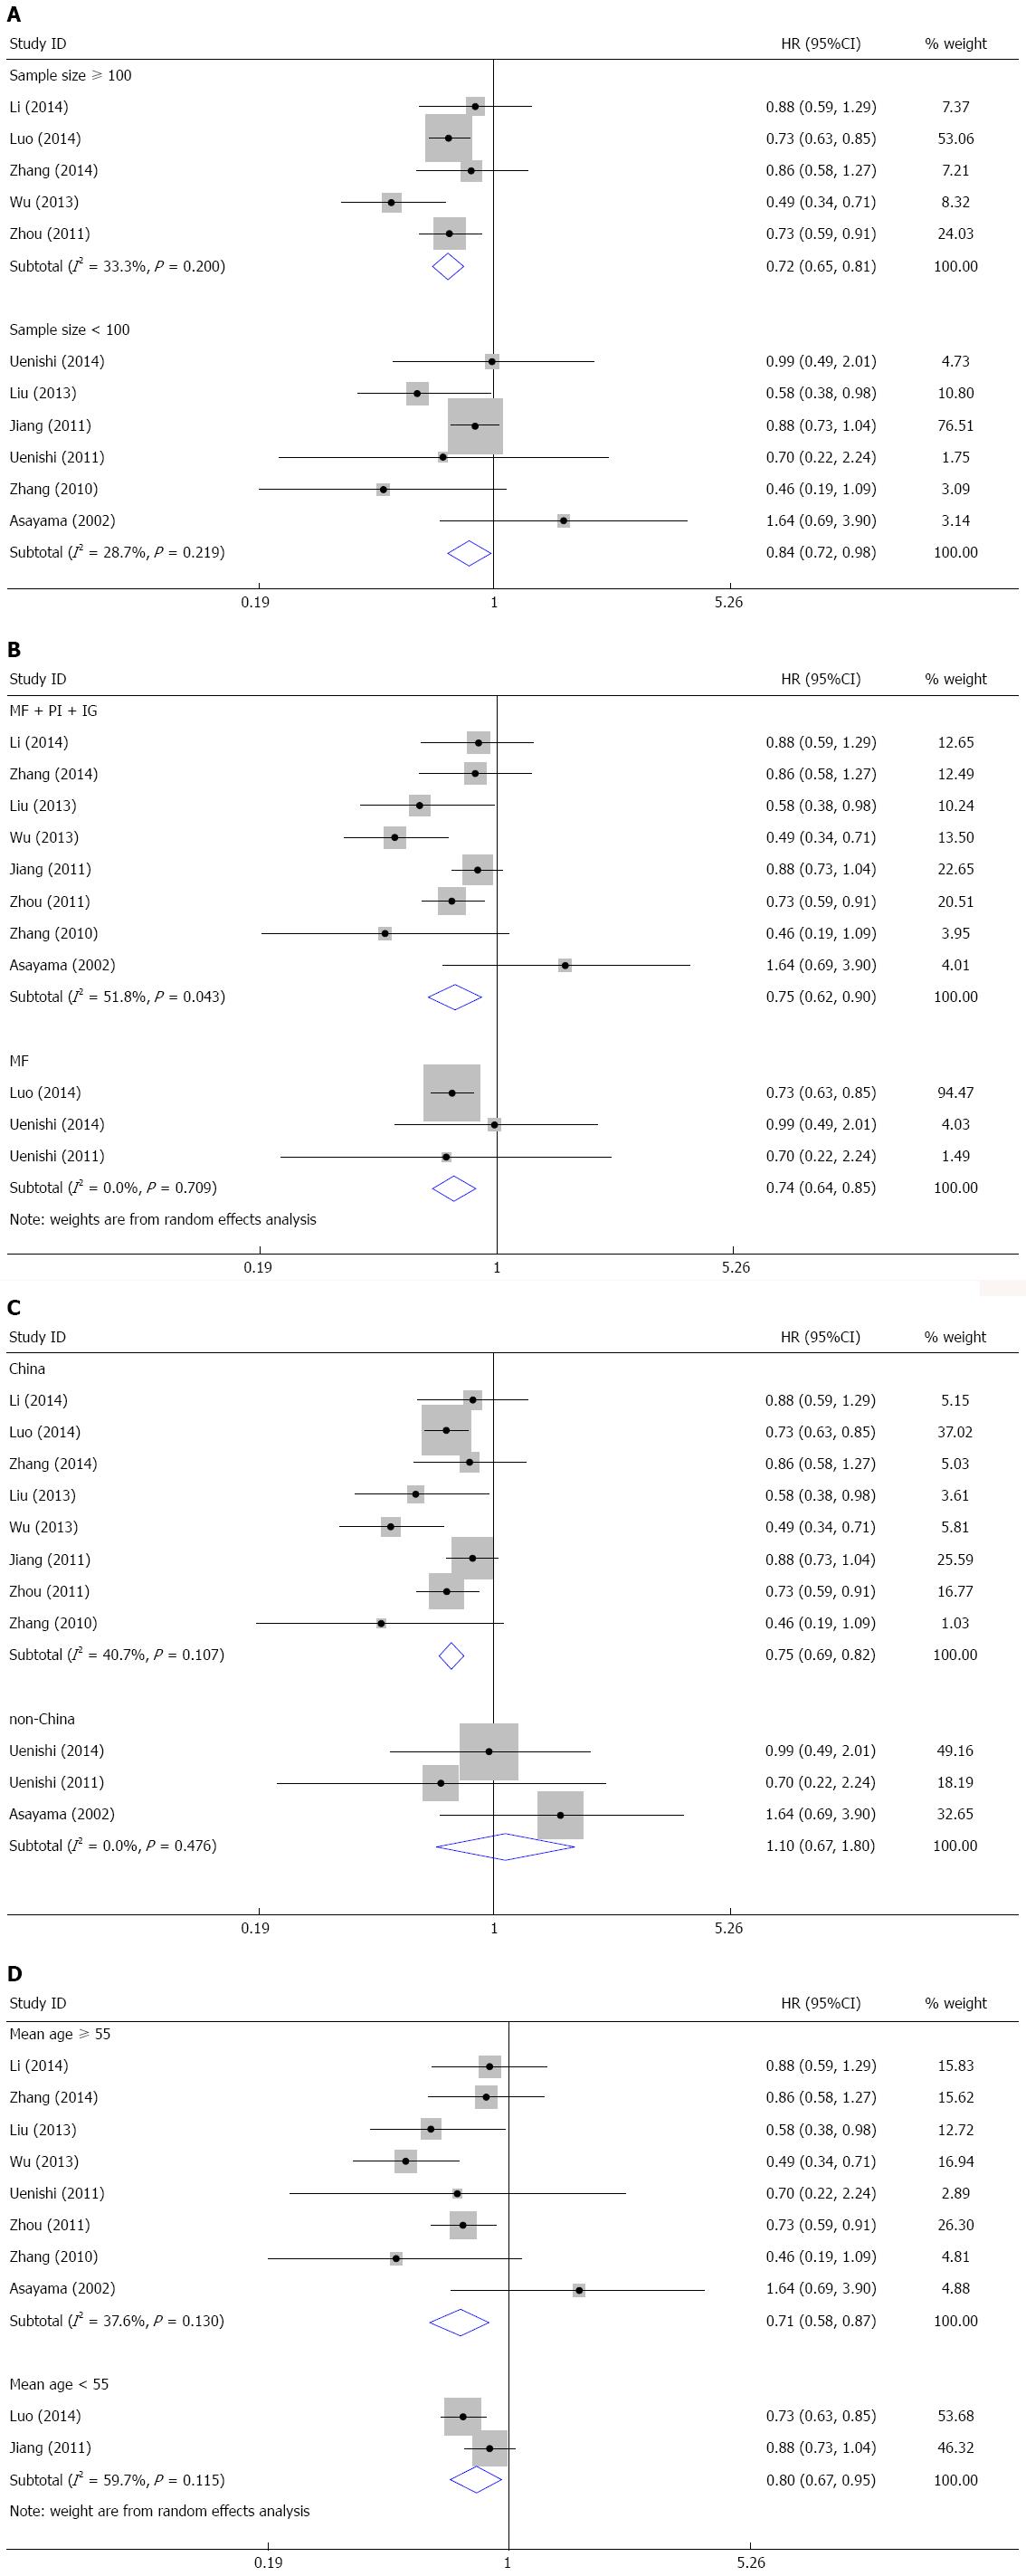
Figure 4 Forest plots of the hazard ratio for the association of hepatitis B virus infection with overall survival by subgroup analysis.
A: By sample size; B: By tumor type; C: By study region; D: By mean age.
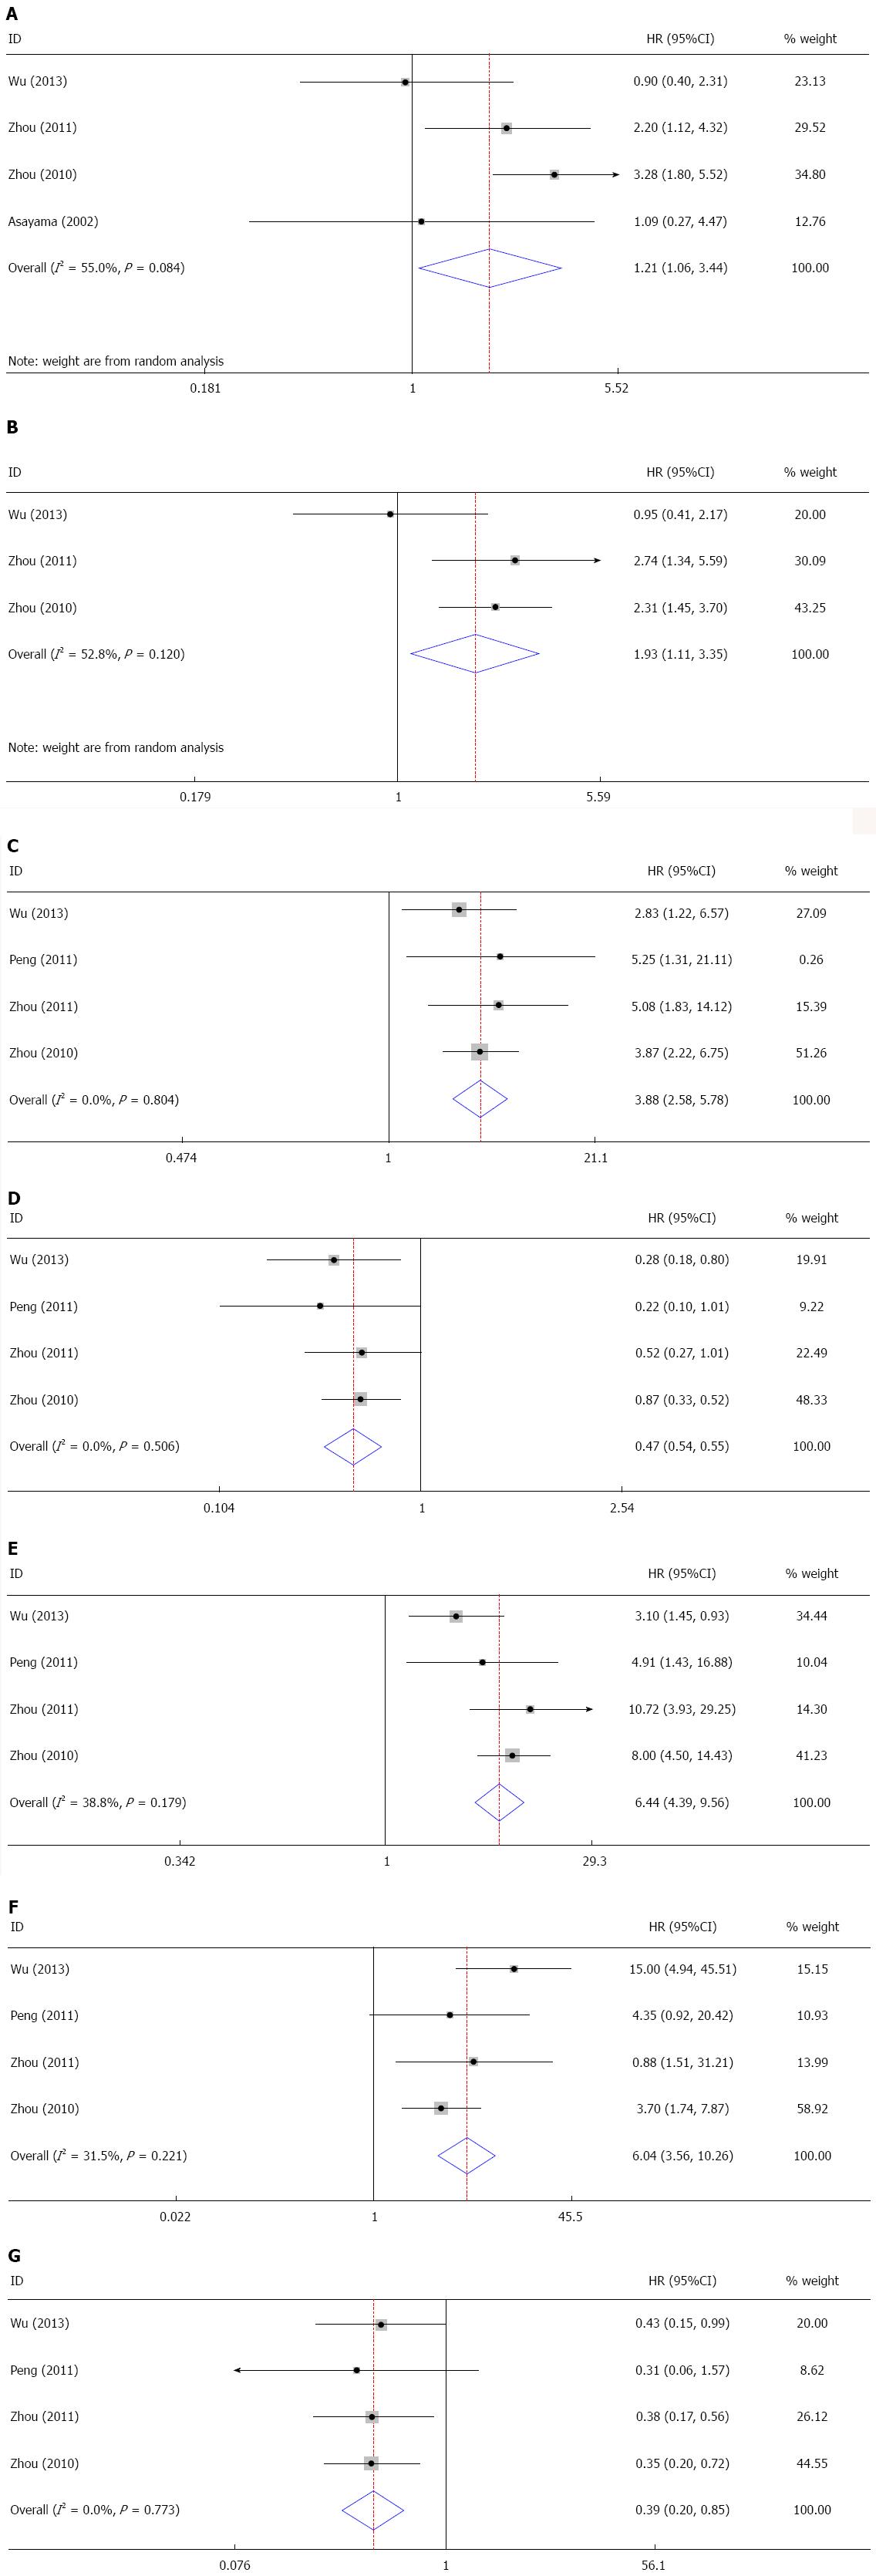
Figure 5 Forest plots of odds ratios for the association of hepatitis B virus infection with clinicopathological features.
A: Meta-analysis for gender; B: Meta-analysis for AST levels; C: Meta-analysis for AFP levels; D: Meta-analysis for CA19-9 levels; E: Meta-analysis for cirrhosis; F: Meta-analysis for capsule formation; G: Meta-analysis for lymph node metastasis.
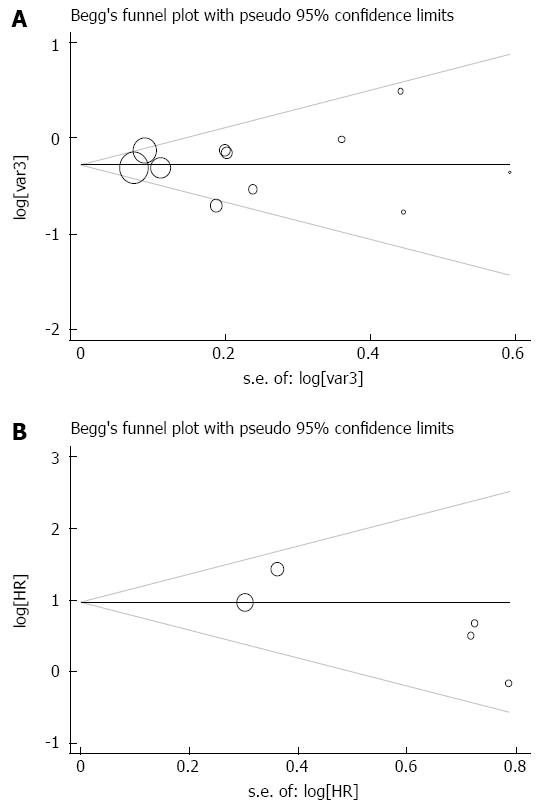
Figure 6 Funnel plots of the studies included in the meta-analysis.
Hepatitis B virus and overall survival (OS); B: Hepatitis C virus and OS.
- Citation: Wang Z, Sheng YY, Dong QZ, Qin LX. Hepatitis B virus and hepatitis C virus play different prognostic roles in intrahepatic cholangiocarcinoma: A meta-analysis. World J Gastroenterol 2016; 22(10): 3038-3051
- URL: https://www.wjgnet.com/1007-9327/full/v22/i10/3038.htm
- DOI: https://dx.doi.org/10.3748/wjg.v22.i10.3038


