Copyright
©The Author(s) 2016.
World J Gastroenterol. Mar 14, 2016; 22(10): 3023-3030
Published online Mar 14, 2016. doi: 10.3748/wjg.v22.i10.3023
Published online Mar 14, 2016. doi: 10.3748/wjg.v22.i10.3023
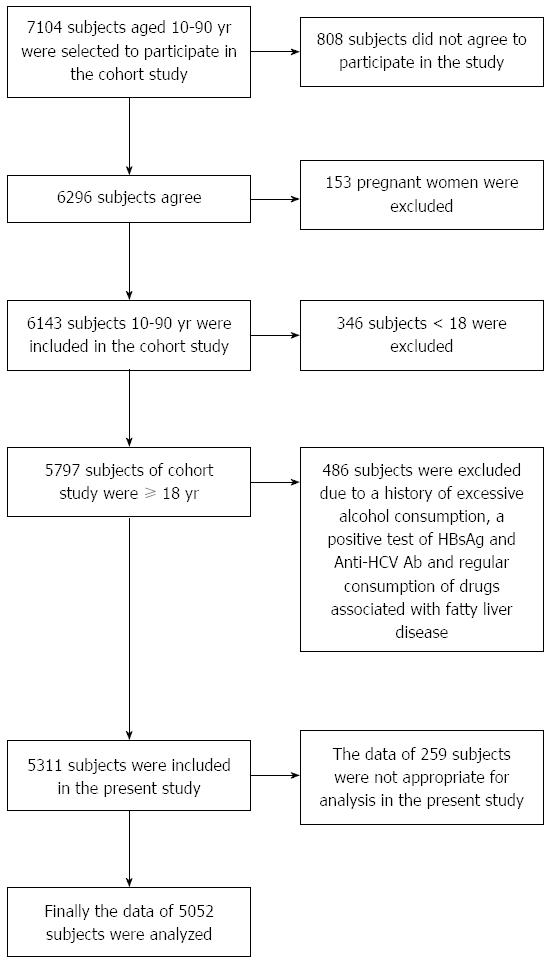
Figure 1 Schematic diagram of study participants and exclusions criteria.
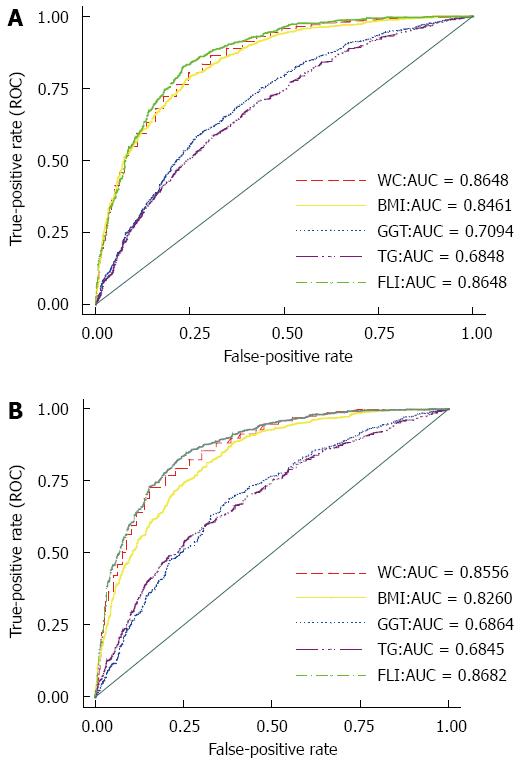
Figure 2 Receiver operating characteristic curves of fatty liver index and their related components.
A and B were related to men and women, respectively. Red color dash pattern curve was related to WC, yellow color solid pattern curve was related to BMI, blue color dot pattern curve was related to GGT, purple color long dash 3-dot pattern curve was related to TG, and lime color dash dot pattern curve was related to FLI. BMI: Body mass index; FLI: Fatty liver index; GGT: Gamma glutamyl transferase; TG: Triglyceride; WC: Waist circumference.
- Citation: Motamed N, Sohrabi M, Ajdarkosh H, Hemmasi G, Maadi M, Sayeedian FS, Pirzad R, Abedi K, Aghapour S, Fallahnezhad M, Zamani F. Fatty liver index vs waist circumference for predicting non-alcoholic fatty liver disease. World J Gastroenterol 2016; 22(10): 3023-3030
- URL: https://www.wjgnet.com/1007-9327/full/v22/i10/3023.htm
- DOI: https://dx.doi.org/10.3748/wjg.v22.i10.3023


