Copyright
©The Author(s) 2016.
World J Gastroenterol. Mar 14, 2016; 22(10): 2931-2948
Published online Mar 14, 2016. doi: 10.3748/wjg.v22.i10.2931
Published online Mar 14, 2016. doi: 10.3748/wjg.v22.i10.2931
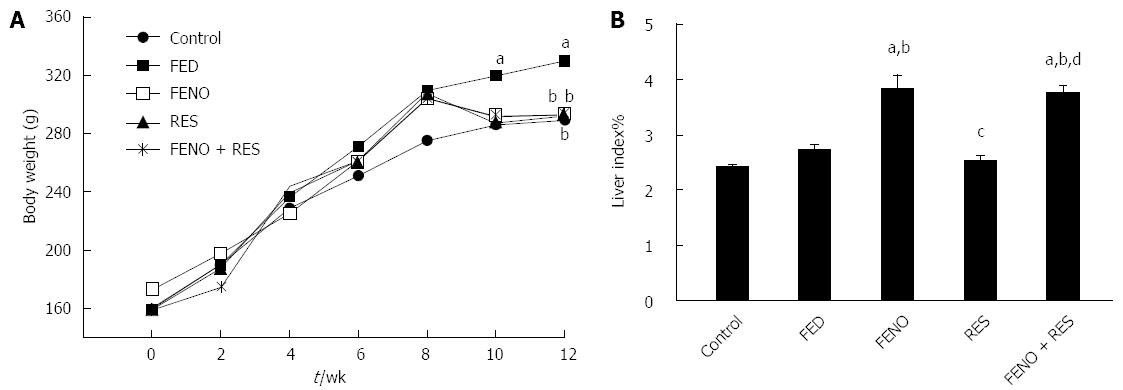
Figure 1 Effect of fenofibrate (100 mg/kg) and resveratrol (70 mg/kg) alone and in combination (half doses) on the body weight (A) and percentage of liver index (B) in fructose-induced NASH in rats.
Values are means ± SE (SE was omitted in Figure 1A body weight for clarification). n = 8-12 rats. The significance of the difference between means was tested by ANOVA followed by Tukey Kramer multiple comparisons test. aP < 0.05 vs control; bP < 0.05 vs FED; cP < 0.05 vs FENO; dP < 0.05 vs RES. FED: Fructose enriched diet; FENO: Fenofibrate; RES: Resveratrol; Liver index: Liver weight/body weight.
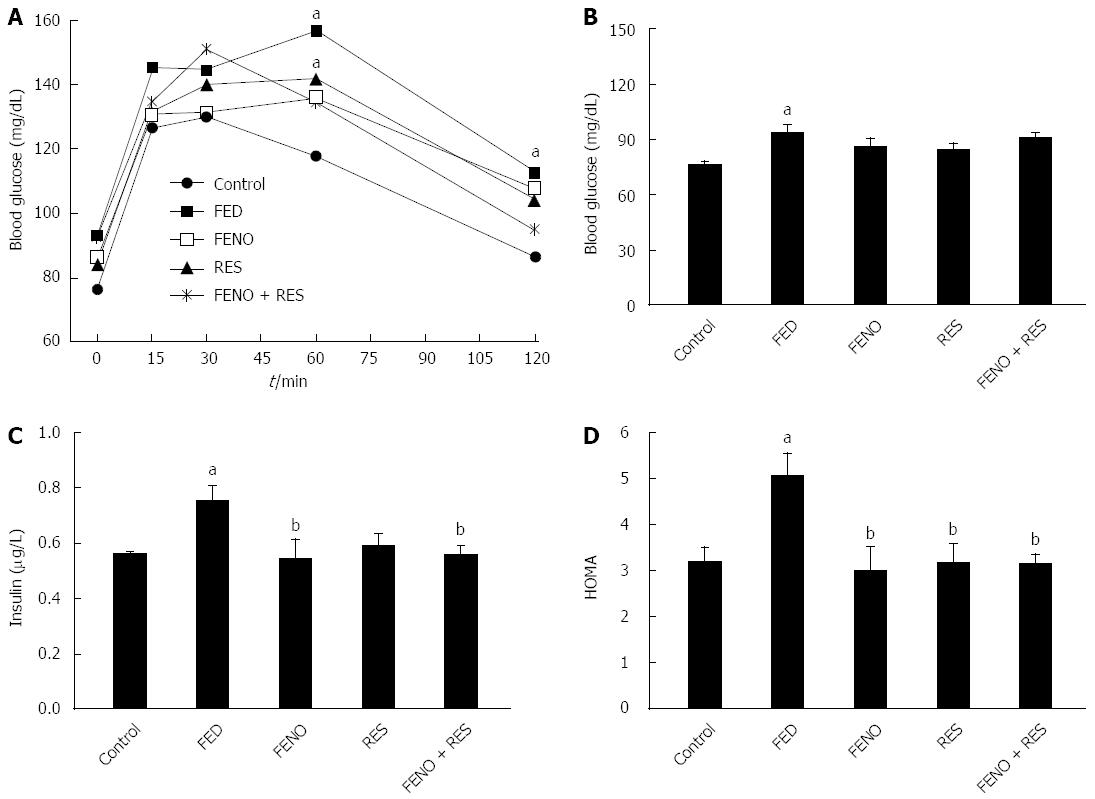
Figure 2 Effect of fenofibrate (100 mg/kg) and resveratrol (70 mg/kg) alone and in combination (half doses) on OGTT (A), blood glucose (B), insulin (C) and HOMA (D) in fructose-induced NASH in rats.
Values are mean ± SE (SE was omitted in Figure 2A OGTT for clarification). n = 8-12 rats.The significance of the difference between means was tested by ANOVA followed by Tukey Kramer multiple comparisons test. aP < 0.05 vs control; bP < 0.05 vs FED. FED: Fructose enriched diet; FENO: Fenofibrate; RES: Resveratrol; OGTT: Oral glucose tolerance test; HOMA: Homeostasis model of assessment.
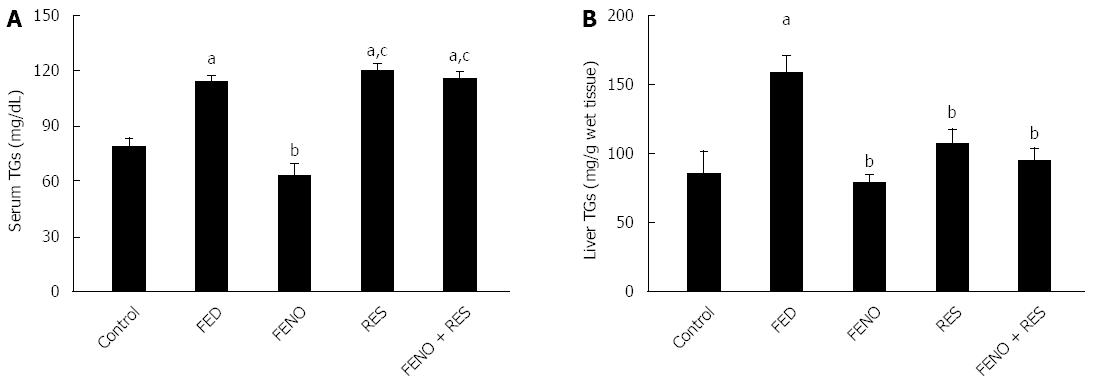
Figure 3 Effect of fenofibrate (100 mg/kg) and resveratrol (70 mg/kg) alone and in combination (half doses) on serum TGs (A) and liver TGs (B) in fructose-induced NASH in rats.
Values are mean ± SE, n = 8-12 rats. The significance of the difference between means was tested by ANOVA followed by Tukey Kramer multiple comparisons test. aP < 0.05 vs control; bP < 0.05 vs FED; cP < 0.05 vs FENO. FED: Fructose enriched diet; FENO: Fenofibrate; RES: Resveratrol; TGs: Triglycerides.
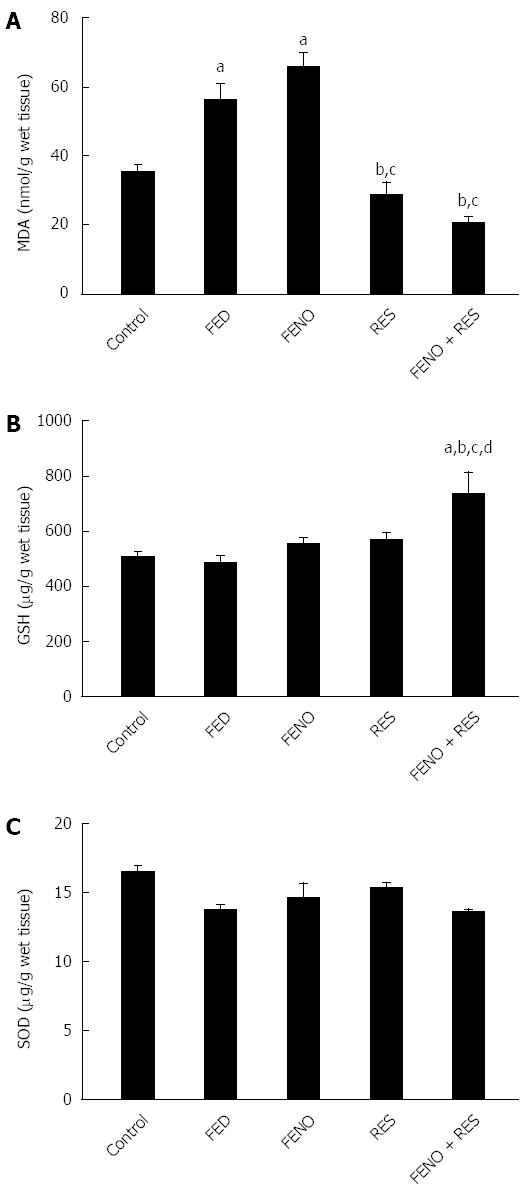
Figure 4 Effect of fenofibrate (100 mg/kg) and resveratrol (70 mg/kg) alone and in combination (half doses) on liver MDA (A), GSH (B) and SOD (C) in fructose-induced NASH in rats.
Values are mean ± SE, n = 8-12 rats. The significance of the difference between means was tested by ANOVA followed by Tukey Kramer multiple comparisons test. aP < 0.05 vs control; bP < 0.05 vs FED; cP < 0.05 vs FENO; dP < 0.05 vs RES. FED: Fructose enriched diet; FENO: Fenofibrate; RES: Resveratrol; MDA: Malonaldehyde; GSH: Glutathione; SOD: Superoxide dismutase.
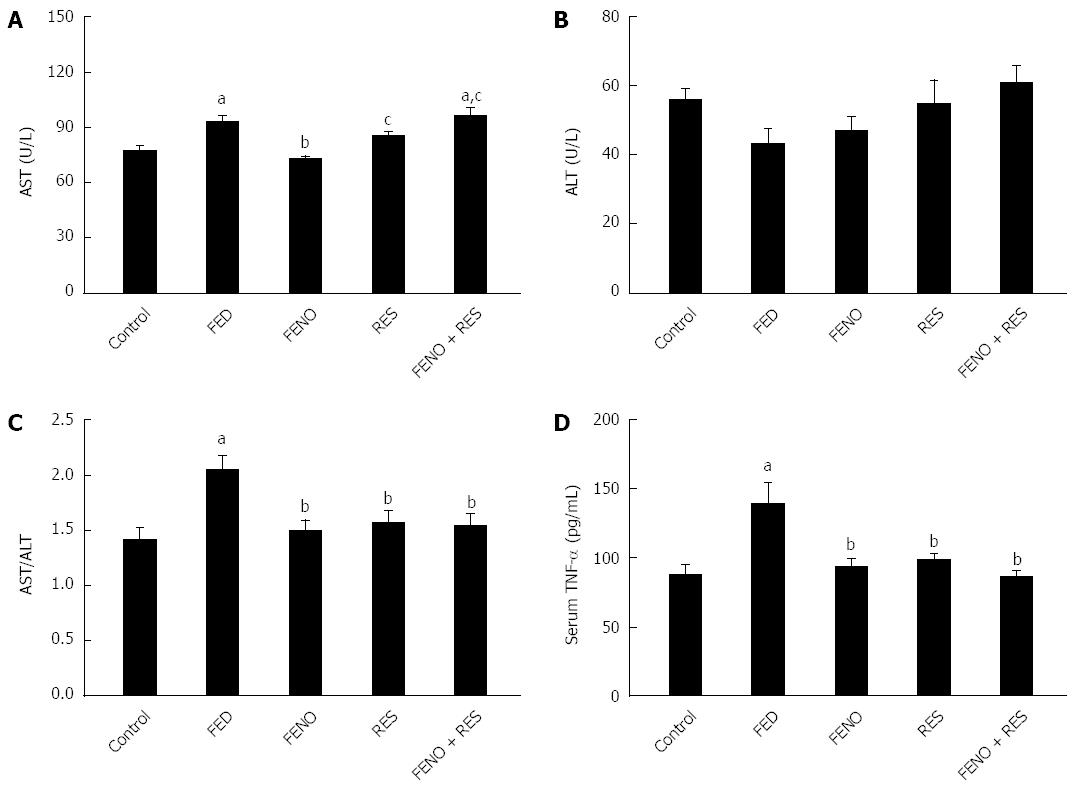
Figure 5 Effect of fenofibrate (100 mg/kg) and resveratrol (70 mg/kg) alone and in combination (half doses) on serum AST (A), ALT (B), AST/ALT ratio (C) and serum TNF-α (D) in fructose-induced NASH in rats.
Values are mean ± SE, n = 8-12 rats. The significance of the difference between means was tested by ANOVA followed by Tukey Kramer multiple comparisons test. aP < 0.05 vs control; bP < 0.05 vs FED; cP < 0.05 vs FENO. FED: Fructose enriched diet; FENO: Fenofibrate; RES: Resveratrol; AST: Aspartate aminotransferase; ALT: Alanine aminotransferase; TNF-α: Tumor necrosis factor-α.
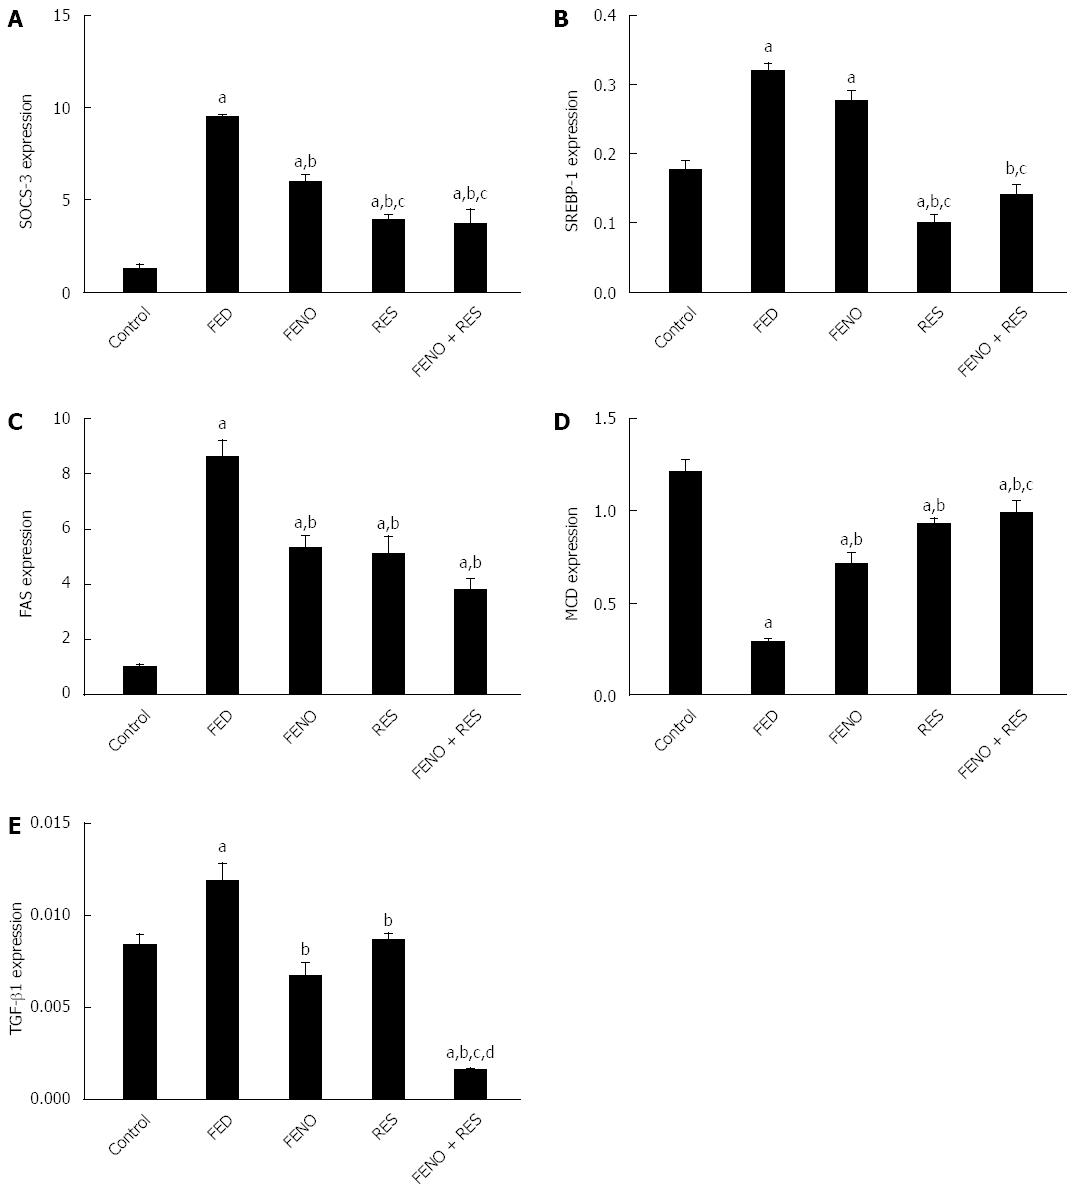
Figure 6 Effect of fenofibrate (100 mg/kg) and resveratrol (70 mg/kg) alone and in combination (half doses) on hepatic genes expression: SOCS-3 (A), SREBP-1c (B), FAS (C), MCD (D) and TGF-β1 (E) in fructose-induced NASH in rats.
Gene expression (level of mRNA) was expressed in arbitrary units based on calculation expression level relative to the internal standard. Values are mean ± SE, n = 8-12 rats.The significance of the difference between means was tested by ANOVA followed by Tukey Kramer multiple comparisons test. aP < 0.05 vs control; bP < 0.05 vs FED; cP < 0.05 vs FENO; dP < 0.05 vs RES. FED: Fructose enriched diet; FENO: Fenofibrate; RES: Resveratrol; SOCS-3: Suppressor of cytokine signalling-3; SREBP-1c: Sterol regulatory element binding protein-1c; FAS: Fatty acid synthase; MCD: Malonyl Co-A decarboxylase.
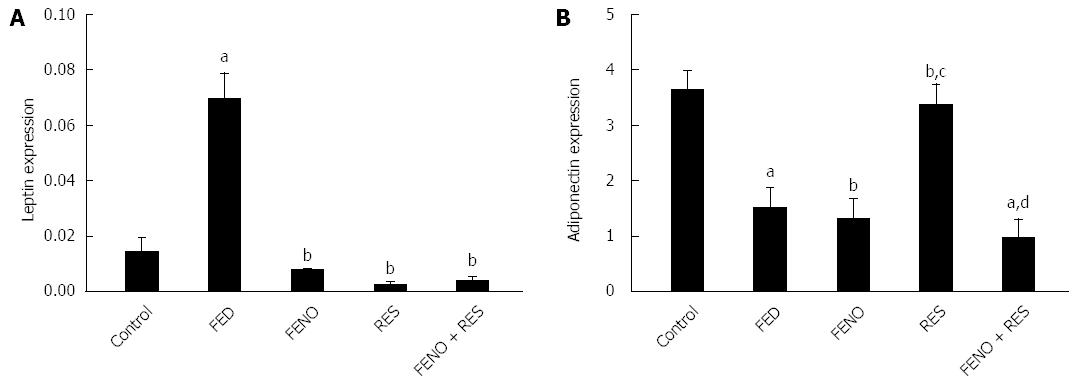
Figure 7 Effect of fenofibrate (100 mg/kg) and resveratrol (70 mg/kg) alone and in combination (half doses) on adipose leptin (A) and adiponectin (B) genes expression in fructose-induced NASH in rats.
Gene expression (level of mRNA) was expressed in arbitrary units based on calculation expression level relative to the internal standard. Values are mean ± SE, n = 8-12 rats. The significance of the difference between means was tested by ANOVA followed by Tukey Kramer multiple comparisons test. aP < 0.05 vs control; bP < 0.05 vs FED; cP < 0.05 vs FENO; dP < 0.05 vs RES. FED: Fructose enriched diet; FENO: Fenofibrate; RES: Resveratrol.
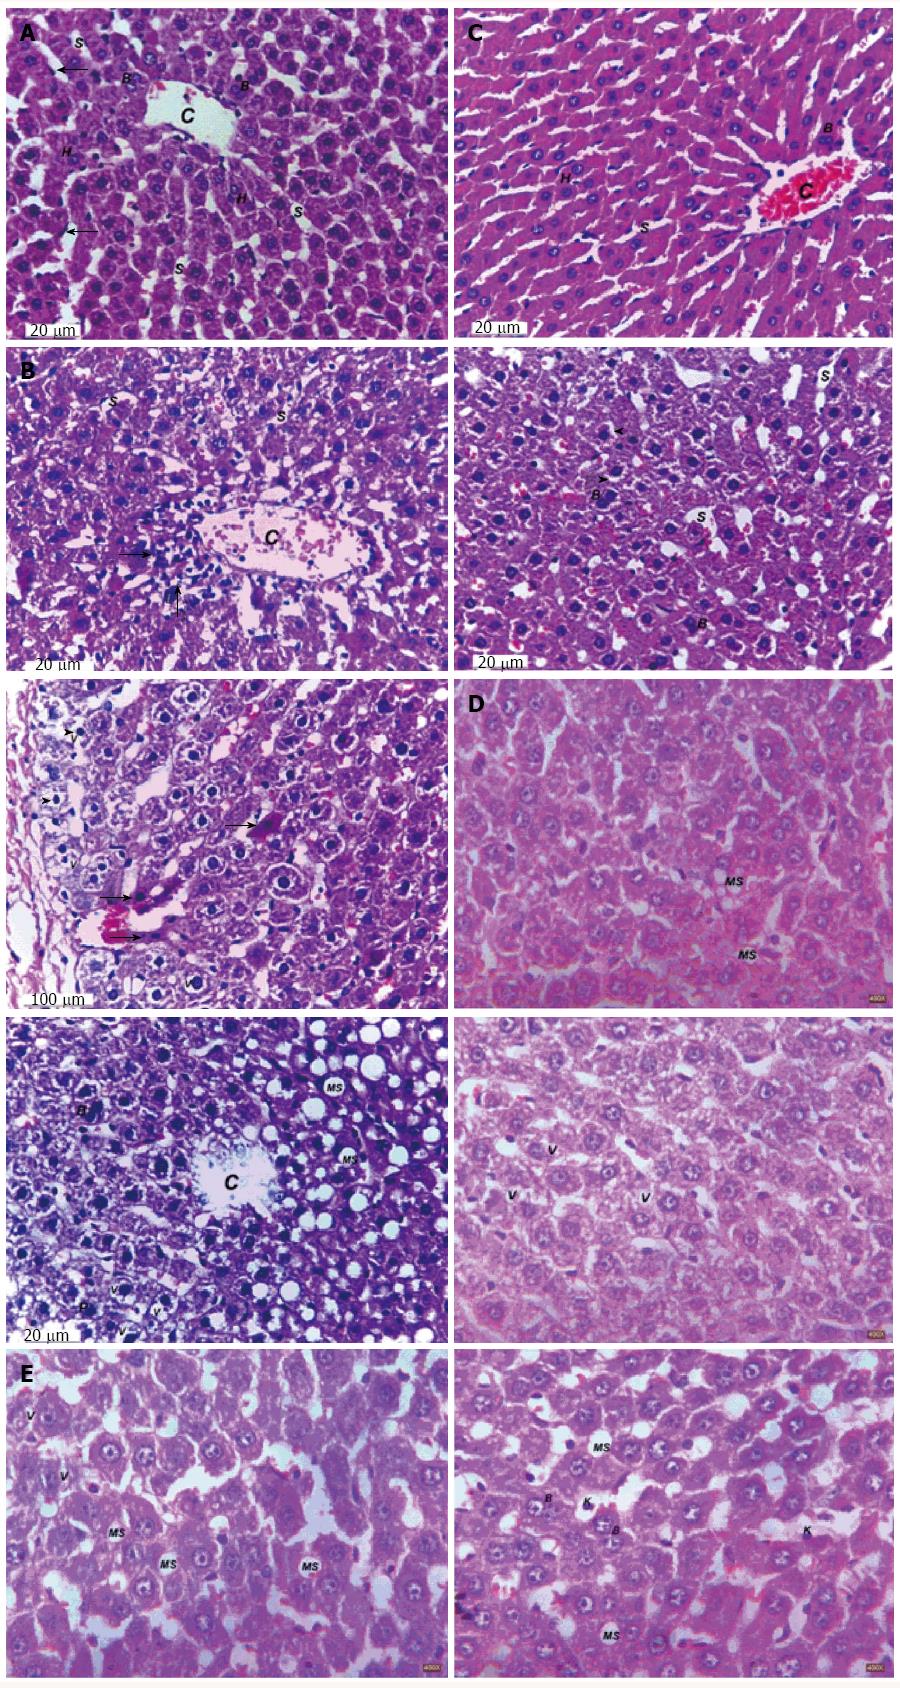
Figure 8 Representative photomicrographs of liver sections of control (A), FED (Bs), fenofibrate (100 mg/kg) (Cs), resveratrol (70 mg/kg) (Ds) and fenofibrate + resveratrol (half doses) (E) in fructose-induced NASH in rats.
A: Control rat liver showing a central vein (C), hepatocytes (H) arranged in the form of plates separated from each other by irregular blood sinusoids (S). B1: Fructose-fed rat liver showing cellular infiltration (arrows) near the central vein (C); B2: Fructose-fed rat liver showing pyknotic hepatic nuclei (arrowheads), cytoplasmic vacuolations (V) and apoptotic hepatic cells (arrows); B3: Fructose-fed rat liver showing central vein (C) with macrovesicular steatosis (MS) compressing hepatic nuclei to the right side of the vein, and cytoplasmic vacuolations (V), pyknotic nuclei (P) and binucleated hepatic cells to the left side of the vein; C1: Fenofibrate-treated rat liver showing nearly normal liver. A central vein (C), hepatocytes (H) arranged in the form of plates separated from each other by irregular blood sinusoids (S); C2: Fenofibrate-treated rat liver showing cytoplasmic vacuolations (arrowheads) of hepatic cells; D1: Resveratrol-treated rat liver showing macrovesicular steatosis (MS); D2: Resveratrol-treated rat liver showing vacuolations (V) of the cytoplasm of the hepatic cells; E1: Fenofibrate + Resveratrol-treated rat liver showing macrovesicular steatosis (MS) not compressing hepatic nuclei; E2: Fenofibrate + Resveratrol-treated rat liver showing macrovesicular steatosis (MS) and vacuolations (V) within the cytoplasm of the hepatic cells (HE × 400).
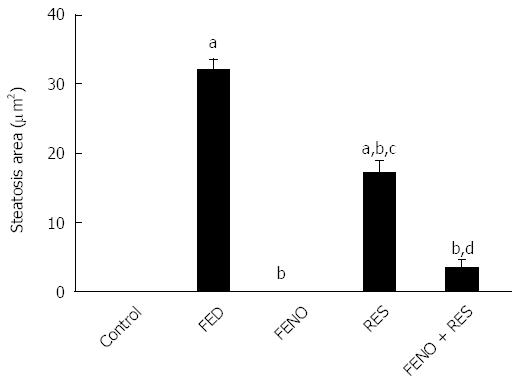
Figure 9 Effect of fenofibrate (100 mg/kg) and resveratrol (70 mg/kg) alone and in combination (half doses) on steatosis area in fructose-induced NASH in rats.
Values are mean ± SE, n = 400 images. The significance of the difference between means was tested by ANOVA followed by Tukey Kramer multiple comparisons test. aP < 0.05 vs control; bP < 0.05 vs FED; cP < 0.05 vs FENO; dP < 0.05 vs RES. FED: Fructose enriched diet; FENO: Fenofibrate; RES: Resveratrol.
- Citation: Abd El-Haleim EA, Bahgat AK, Saleh S. Resveratrol and fenofibrate ameliorate fructose-induced nonalcoholic steatohepatitis by modulation of genes expression. World J Gastroenterol 2016; 22(10): 2931-2948
- URL: https://www.wjgnet.com/1007-9327/full/v22/i10/2931.htm
- DOI: https://dx.doi.org/10.3748/wjg.v22.i10.2931


