Copyright
©The Author(s) 2016.
World J Gastroenterol. Jan 7, 2016; 22(1): 284-299
Published online Jan 7, 2016. doi: 10.3748/wjg.v22.i1.284
Published online Jan 7, 2016. doi: 10.3748/wjg.v22.i1.284
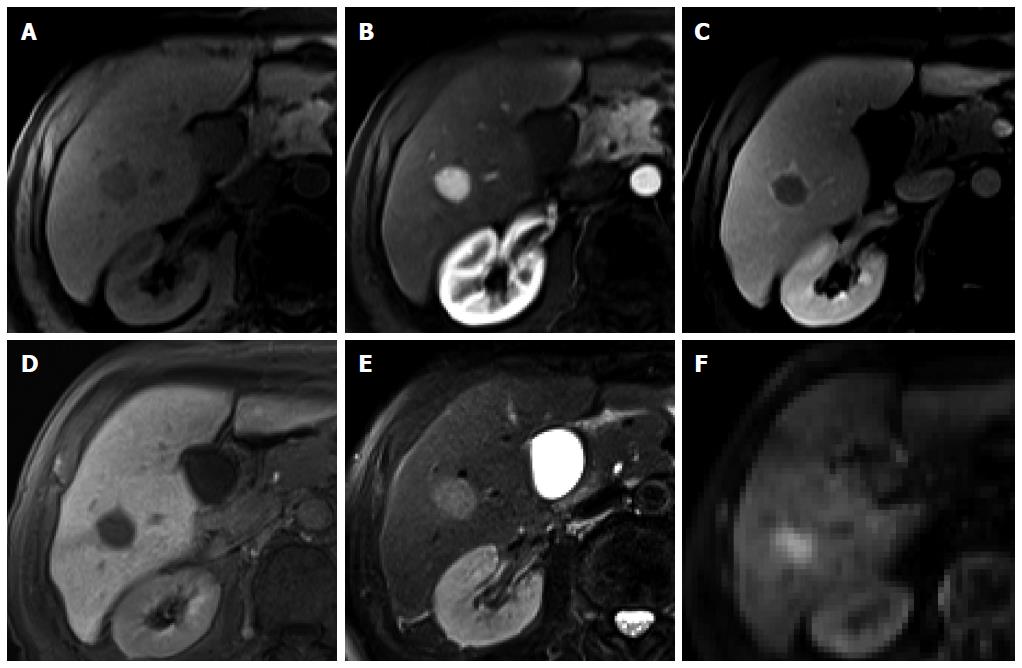
Figure 1 Hepatocellular carcinoma in a 74-year-old man with hepatitis C infection.
A: Precontrast T1-weighted image shows a hypointense nodule in segment 6; B: Hepatic arterial phase of gadoxetic acid-enhanced MRI shows homogeneous marked enhancement of the tumor; C: Transitional phase shows washout of the contrast medium in the tumor with capsular enhancement; D: Hepatobiliary phase shows marked hypointensity of the tumor relative to the liver parenchyma; E, F: T2-weighted image and diffusion weighted image (b = 800) show high SI of the tumor.
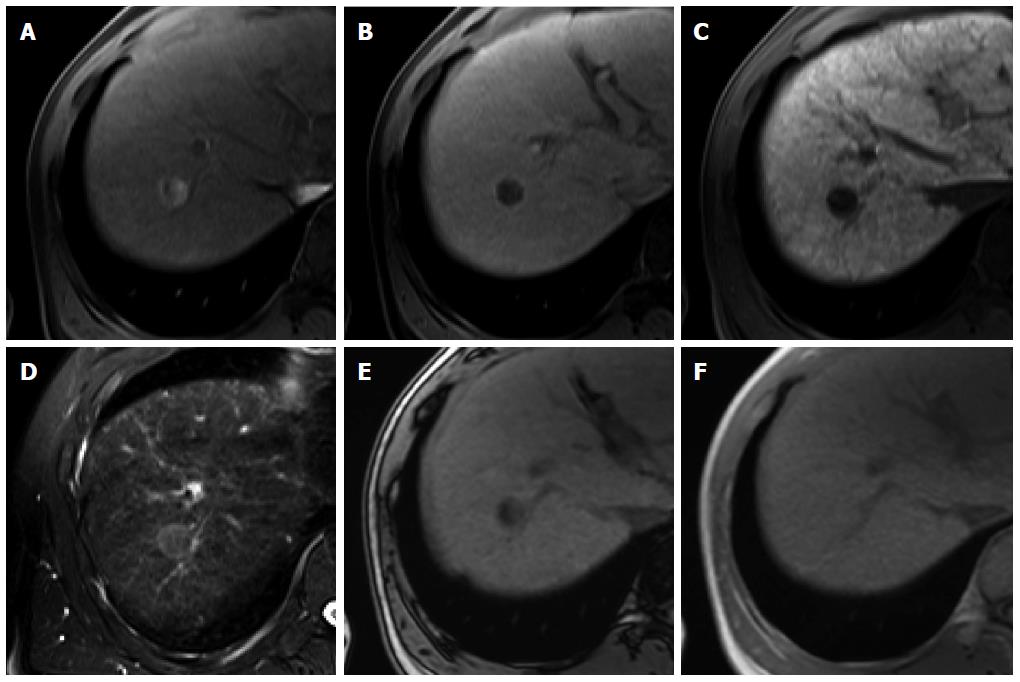
Figure 2 Fat-containing hepatocellular carcinoma in a 57-year-old man with hepatitis B infection.
A: Hepatic arterial phase using gadoxetic acid shows heterogeneously arterial enhancement with intralesional low SI area; B: Transitional phase shows washout of the contrast medium in the tumor with capsular enhancement; C: Hepatobiliary phase shows marked hypointensity of the tumor relative to the liver parenchyma; D: T2-weighted image shows high signal intensity of the tumor; E, F: Opposed phase (E) and in-phase (F) T1-weighted gradient echo images reveals area of signal drop on opposed-phase image, indicating fat-containing lesion.
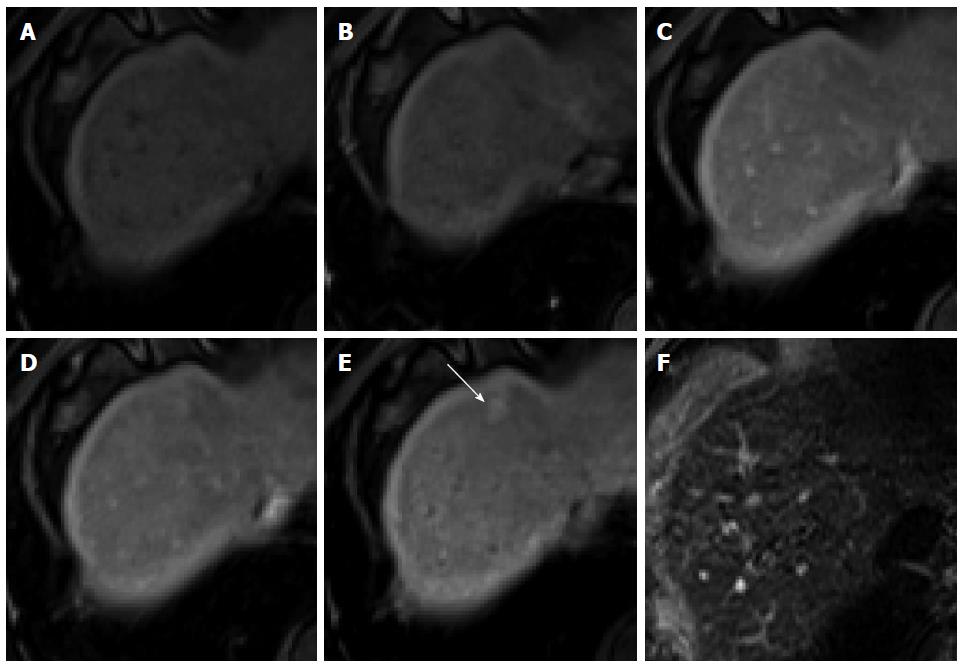
Figure 3 Regenerative nodule in a 61-year-old man with alcoholic liver cirrhosis.
A-D: Precontrast T1-weighted image, hepatic arterial phase, portal venous phase, and transitional phase show no visible lesion in the scanned area; E: Hepatobiliary phase shows a hyperintense nodule (arrow) in hepatic S4; F: T2-weighted image shows isointensity of the tumor.
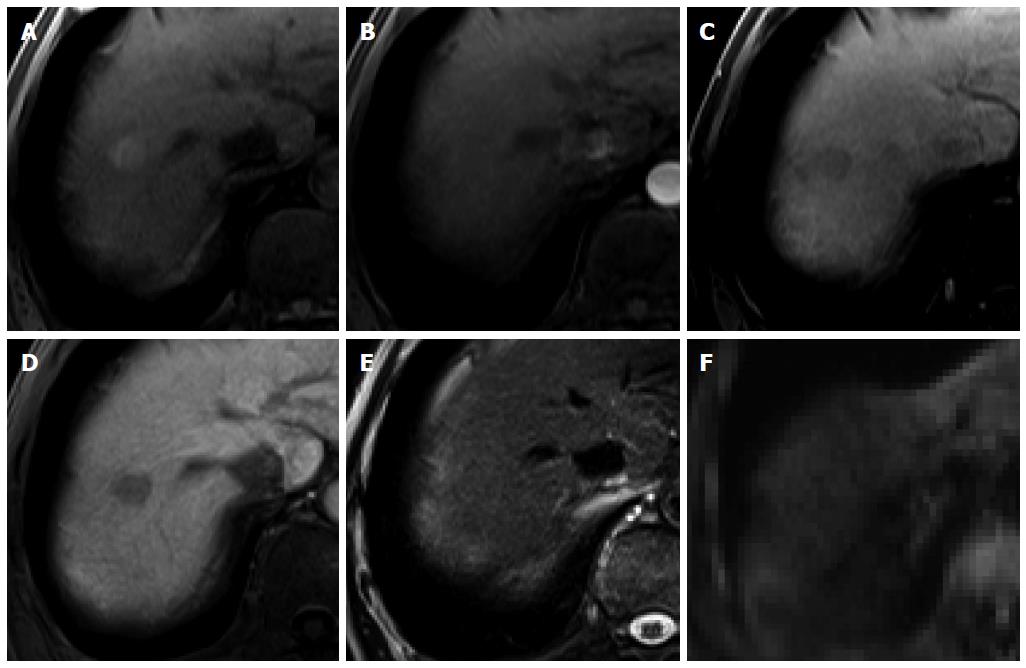
Figure 4 Dysplastic nodule in the same patient as Figure 1.
A: precontrast T1-weighted image shows a hyperintense nodule in segment 8, suggesting high contents of iron or copper; B: Hepatic arterial phase of gadoxetic acid-enhanced MRI shows isointensity of the tumor; C, D: transitional and hepatobiliary phases show hypointensity of the tumor relative to the liver parenchyma; E, F: T2-weighted image and diffusion weighted image (b = 800) show isointensity of the tumor.
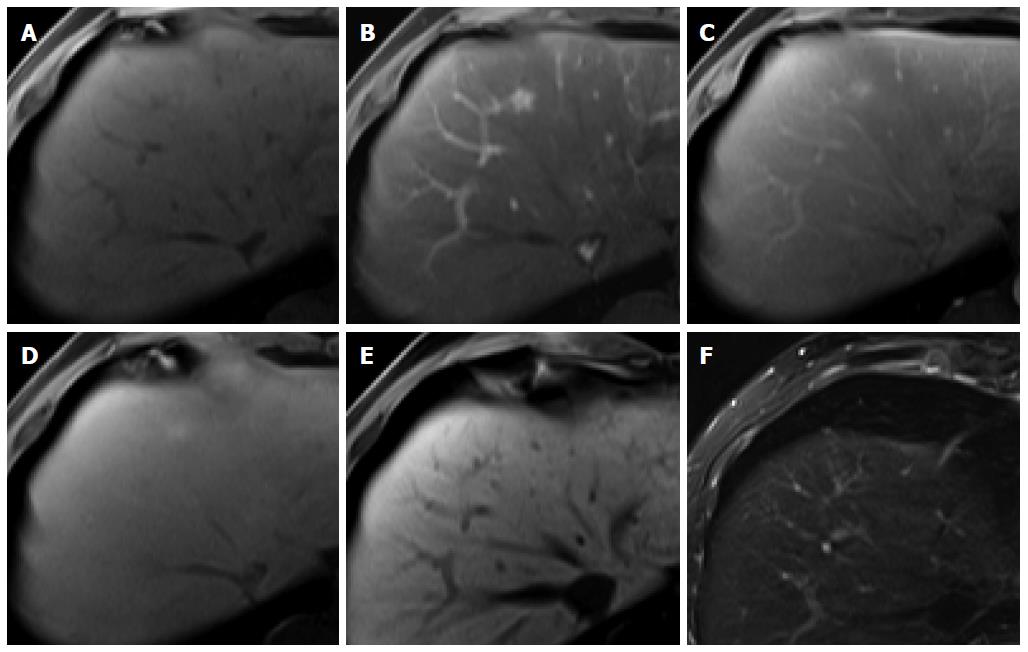
Figure 5 Focal nodular hyperplasia-like nodule in a 45-year-old man with hepatitis B infection.
A: Precontrast T1-weighted image shows isointensity of the tumor; B: Hepatic arterial phase using gadoxetic acid shows lobulating-contoured, marked enhanced nodule in segment 4; C, D: Portal venous and transitional phases show slight hyperenhancement of the tumor relative to the liver parenchyma; E: Hepatobiliary phase shows isointensity or subtle peripheral ring-like enhancement of the tumor; F: T2-weighted image shows isointensity of the tumor.
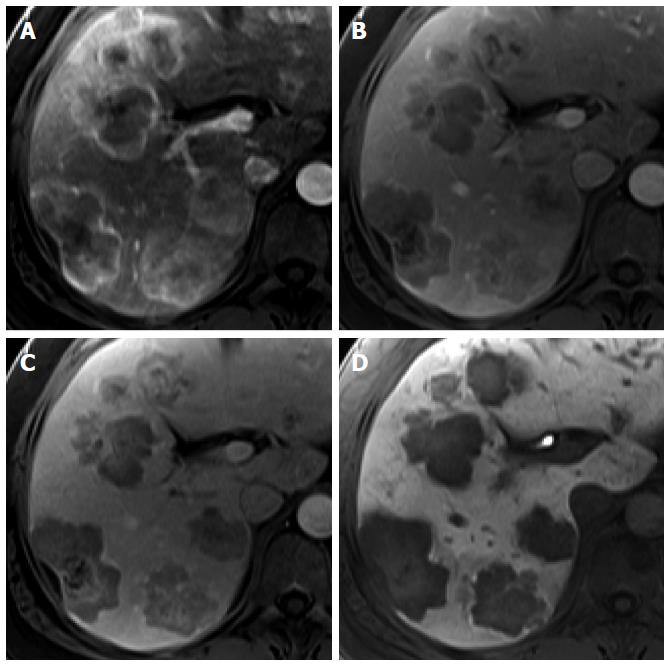
Figure 6 Intrahepatic cholangiocarcinoma in an 80-year-old man.
A: Hepatic arterial phase using gadoxetic acid shows peripheral arterial enhancing mass with capsular retraction at the hepatic segment 8 subcapsular location; B: Portal venous and transitional phases show target appearance with peripheral enhancement and central nonenhancement; C, D: Hepatobiliary phase also shows low signal intensity of the most outer portion, high signal intensity of mid portion, and marked low signal intensity of the center of the tumor.
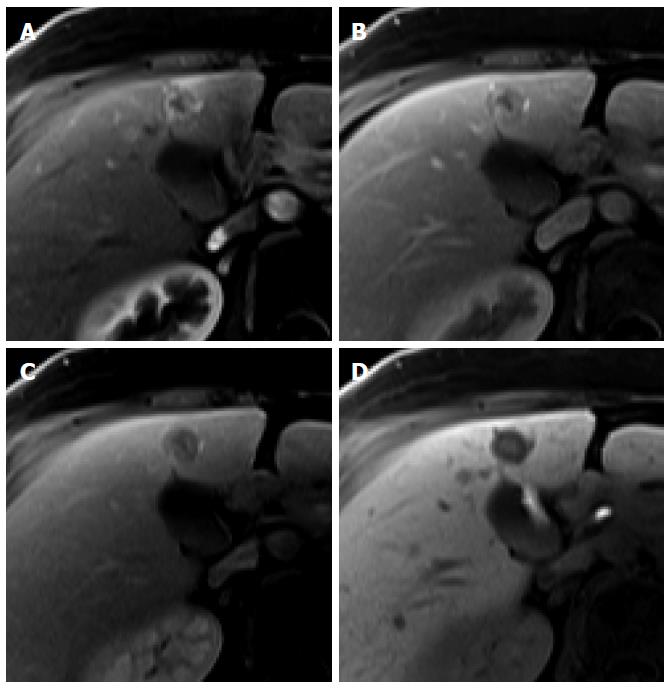
Figure 7 Intrahepatic cholangiocarcinoma in an 80-year-old man.
A: Hepatic arterial phase using gadoxetic acid shows heterogeneously arterial enhancing nodule in hepatic segment 4 dome; B, C: Portal venous and transitional phases show delayed washout; D: Hepatobiliary phase shows target appearance with peripheral low signal intensity and central high signal intensity.
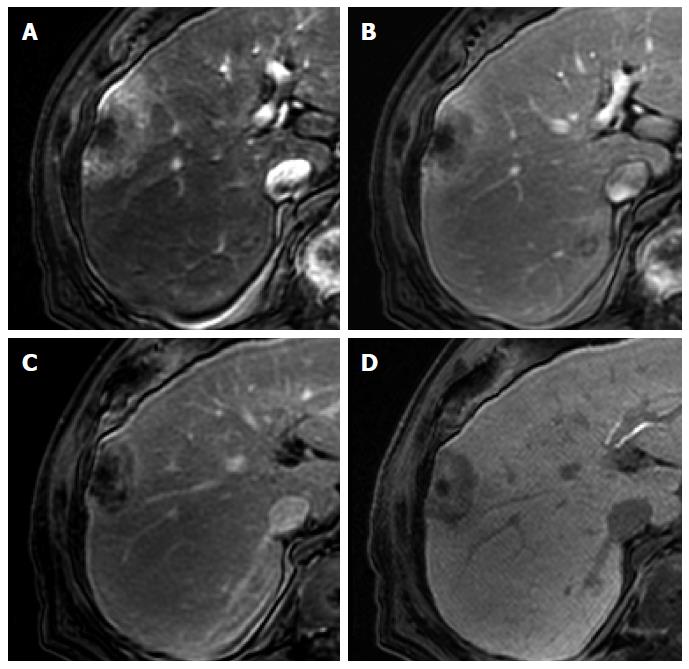
Figure 8 Focal nodular hyperplasia in a 55-year-old woman.
A: Hepatic arterial phase image of gadoxetic acid-enhanced etic resonance imaging shows lobulating contoured, marked enhanced tumor; B, C: Portal venous and transitional phases show slightly hyperenhancement of the tumor relative to the liver parenchyma, and central hypointense area is suspected as central scar; D: Hepatobiliary phase shows peripheral ring-like enhancement of the tumor with larger area of markedly hypointense central scar as compared with the other phase images.
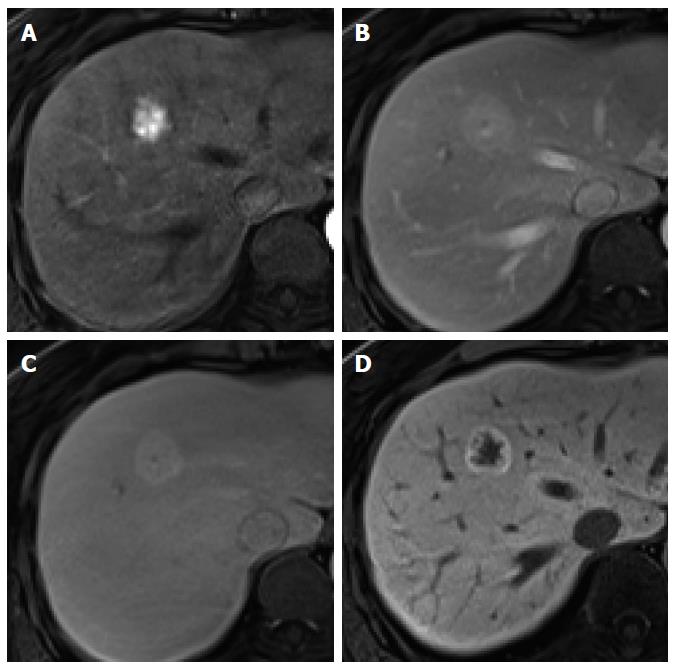
Figure 9 Hepatocellular adenoma in a 45-year-old woman.
A: Hepatic arterial phase using gadoxetic acid shows moderate arterial enhancement; B: Transitional phase shows delayed washout without capsule or pseudocapsule; C: Hepatobiliary phase shows heterogeneous low signal intensity of the tumor; D: T2-weighted image shows a peripheral hyperintense band with moderate high signal intensity of residual tumor.
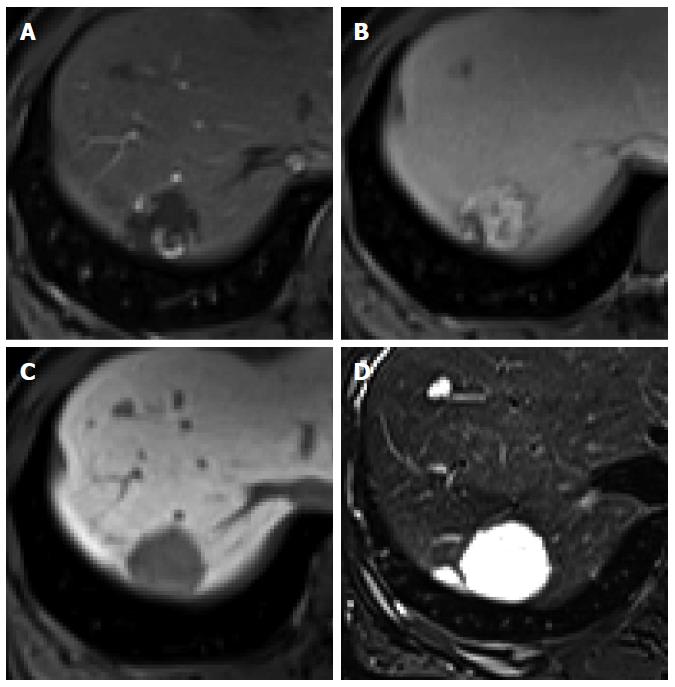
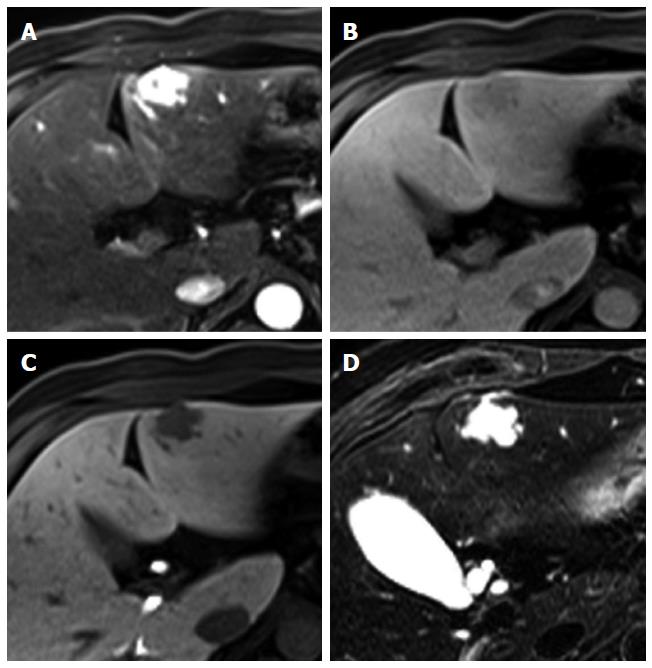
Figure 10 Hepatic hemangioma in a 45-year-old woman.
A: Hepatic arterial phase using gadoxetic acid shows peripheral nodular enhancement of the tumor in segment 7; B: Transitional phase shows centripetal and prolonged enhancement; C: Hepatobiliary phase shows hypointense defect relative to hepatic parenchyma; D: T2-weighted image shows bright and high signal intensity.
Figure 11 Hepatic hemangioma in a 54-year-old man.
A: Hepatic arterial phase in gadoxetic acid-enhanced MRI shows homogeneous marked enhancement of the tumor in segment 3; B: Transitional phase shows slightly low signal intensity of the tumor relative to the liver parenchyma; C: Hepatobiliary phase shows more markedly low signal intensity of the tumor; D: T2-weighted image shows bright and high signal intensity of the tumor.
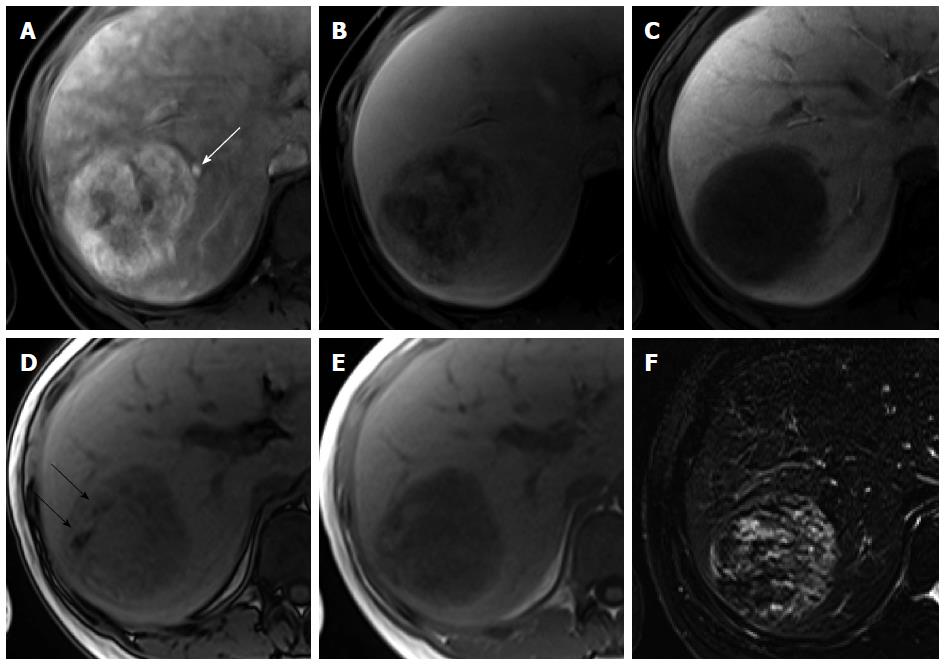
Figure 12 Angiomyolipoma in a 33-year-old woman.
A: Hepatic arterial phase using gadoxetic acid shows heterogeneous arterial enhancement of the tumor. Early venous drainage to the right hepatic vein is seen (white arrow); B: Transitional phase shows heterogeneously low signal intensity; C: Hepatobiliary phase shows homogeneously low signal intensity; D, E: Opposed phase (D) and in-phase (E) T1-weighted gradient echo images reveal hypointense mass with area of signal drop on opposed-phase image (black arrows), indicating fat-containing lesion; F: T2-weighted image shows heterogeneous signal intensity of the tumor.
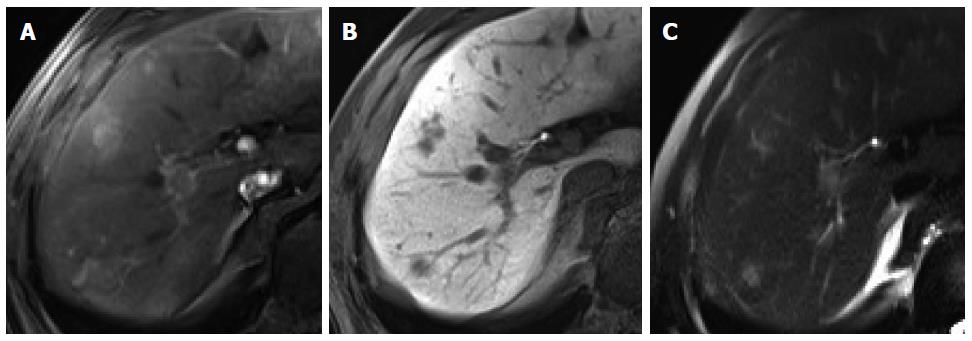
Figure 13 Focal eosinophilic infiltration in a 52-year-old man.
A: Hepatic arterial phase of gadoxetic acid-enhanced MRI shows two irregular homogeneously enhancing nodular lesions in segments 7 and 8; B: Hepatobiliary phase shows low signal intensities with ill-defined margin and nonspherical shape; C: Heavily T2-weighted image shows smaller size of the lesions in S8, compared to (B).
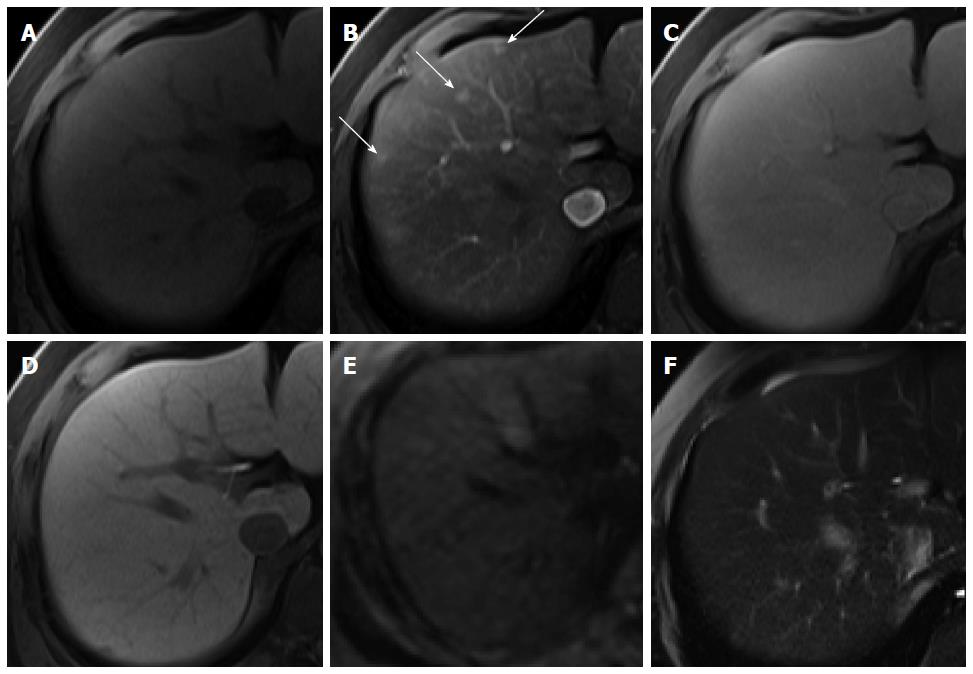
Figure 14 Hypervascular pseudolesion in a 49-year-old man with normal liver.
A: Precontrast T1-weighted image shows no focal hepatic lesion; B: Hepatic arterial phase using gadoxetic acid shows several arterial enhancing nodular lesions in the liver (arrows); C-F: Transitional, hepatobiliary, T2-weighted, and diffusion weighted images show no signal change.
Figure 15 Hepatic metastasis from colon cancer in a 74-year-old man.
A: Hepatic arterial phase using gadoxetic acid shows multiple arterial rim-like enhancing tumors with lobulating margin; B, C: Portal venous and transitional phases show heterogeneously low signal intensity of the tumors; D: Hepatobiliary phase shows peripheral hypointense rim with subtle high signal intensity of the center.
Figure 16 Hepatic metastasis from breast cancer in a 61-year-old woman.
A: Hepatic arterial phase using gadoxetic acid shows arterial rim-like enhancement; B, C: Portal venous and transitional phases show delayed washout of periphery of the tumor with central nonenhancement; D: Hepatobiliary phase shows target appearance with subtle high signal intensity of the center and peripheral low signal intensity rim.
- Citation: Park YS, Lee CH, Kim JW, Shin S, Park CM. Differentiation of hepatocellular carcinoma from its various mimickers in liver magnetic resonance imaging: What are the tips when using hepatocyte-specific agents? World J Gastroenterol 2016; 22(1): 284-299
- URL: https://www.wjgnet.com/1007-9327/full/v22/i1/284.htm
- DOI: https://dx.doi.org/10.3748/wjg.v22.i1.284


