Copyright
©The Author(s) 2015.
World J Gastroenterol. Mar 7, 2015; 21(9): 2770-2776
Published online Mar 7, 2015. doi: 10.3748/wjg.v21.i9.2770
Published online Mar 7, 2015. doi: 10.3748/wjg.v21.i9.2770
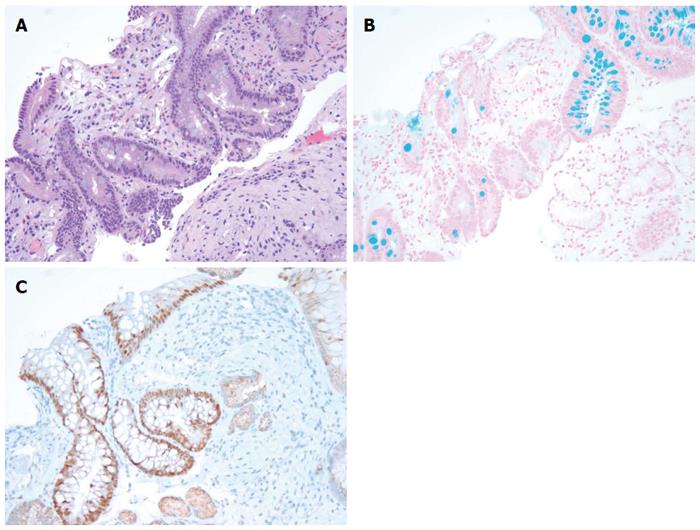
Figure 1 An example of Barrett mucosa showing numerous goblet cells (A) which are positive for alcian blue pH 2.
5 stain (B) and CDX2 (C). Magnification × 200.
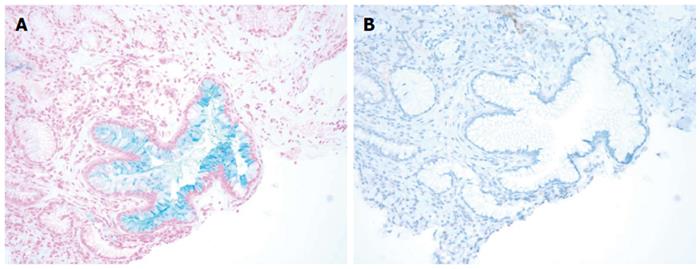
Figure 2 Biopsy showing glands with columnar blue cells on the alcian blue pH 2.
5 staining (A) while the same cells are negative when stained with CDX2 (B). Magnification × 200.
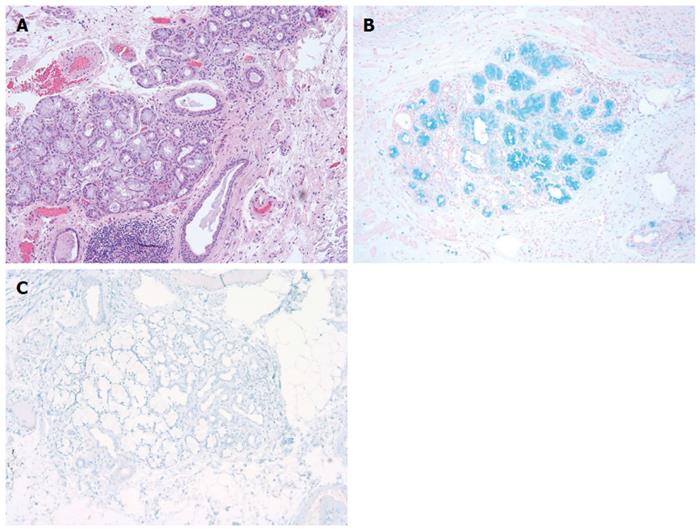
Figure 3 Image of esophageal glands with associated esophageal gland ducts (A) strongly positive for alcian blue pH 2.
5 staining (B) but are negative for CDX2 (C). Magnification × 200.
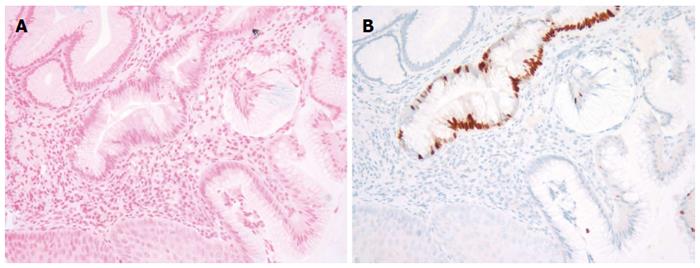
Figure 4 Esophago-gastric mucosa showing negativity for intestinal metaplasia on the alcian blue pH 2.
5 staining (A), but strong positivity on the CDX2 immunostain (B). Magnification × 200.
- Citation: Johnson DR, Abdelbaqui M, Tahmasbi M, Mayer Z, Lee HW, Malafa MP, Coppola D. CDX2 protein expression compared to alcian blue staining in the evaluation of esophageal intestinal metaplasia. World J Gastroenterol 2015; 21(9): 2770-2776
- URL: https://www.wjgnet.com/1007-9327/full/v21/i9/2770.htm
- DOI: https://dx.doi.org/10.3748/wjg.v21.i9.2770


