Copyright
©The Author(s) 2015.
World J Gastroenterol. Mar 7, 2015; 21(9): 2614-2621
Published online Mar 7, 2015. doi: 10.3748/wjg.v21.i9.2614
Published online Mar 7, 2015. doi: 10.3748/wjg.v21.i9.2614
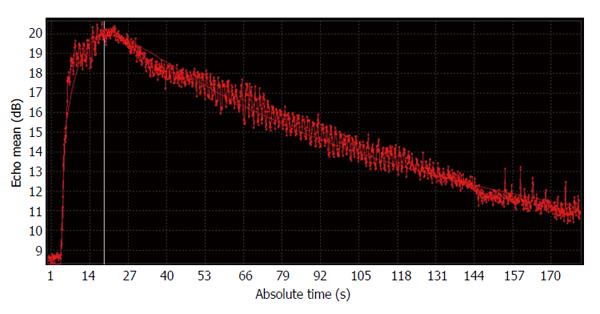
Figure 1 Time-intensity curve from contrast enhancement ultrasonography of the liver of a rabbit.
The contrast enhancement ultrasonography (CEUS) was performed with a high frequency linear transducer and the time-intensity curve was automatically presented as an absolute time to echo mean (dB) curve with a curve fitting method.
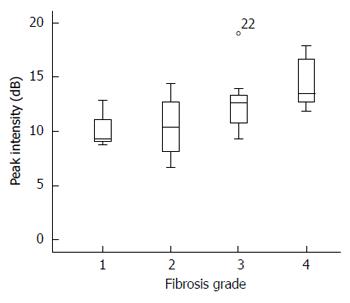
Figure 2 Peak signal intensity and liver fibrosis grade associations.
The peak signal intensity measured on the last day showed significant association with liver fibrosis grades with an OR = 1.392 (95%CI: 1.114-1.741, P = 0.004).
- Citation: Shin HJ, Chang EY, Lee HS, Hong JH, Park G, Kim HG, Kim MJ, Lee MJ. Contrast-enhanced ultrasonography for the evaluation of liver fibrosis after biliary obstruction. World J Gastroenterol 2015; 21(9): 2614-2621
- URL: https://www.wjgnet.com/1007-9327/full/v21/i9/2614.htm
- DOI: https://dx.doi.org/10.3748/wjg.v21.i9.2614


