Copyright
©The Author(s) 2015.
World J Gastroenterol. Mar 7, 2015; 21(9): 2593-2604
Published online Mar 7, 2015. doi: 10.3748/wjg.v21.i9.2593
Published online Mar 7, 2015. doi: 10.3748/wjg.v21.i9.2593
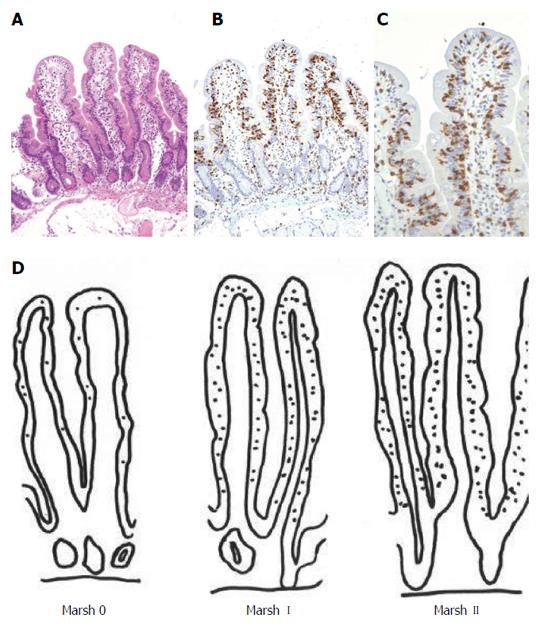
Figure 1 Legends for micrographs.
A: Microscopic enteritis (ME), normal villi with pathological increase of T lymphocytes, HE × 10; B: ME with immunohistochemistry for CD3 × 10; C: ME; evident pathological number of T lymphocytes in the superficial epithelium of villi. CD3 immunohistochemistry × 40; D: This diagram is representative of the phases of ME, in addition to the Marsh I ("infiltrated") and Marsh II ("infiltrated-hyperplastic") lesions, it is important to note that a histologically normal-appearing mucosa is a part of the ME spectrum, and that its underlying pathological connotations should therefore not be overlooked nor ignored.
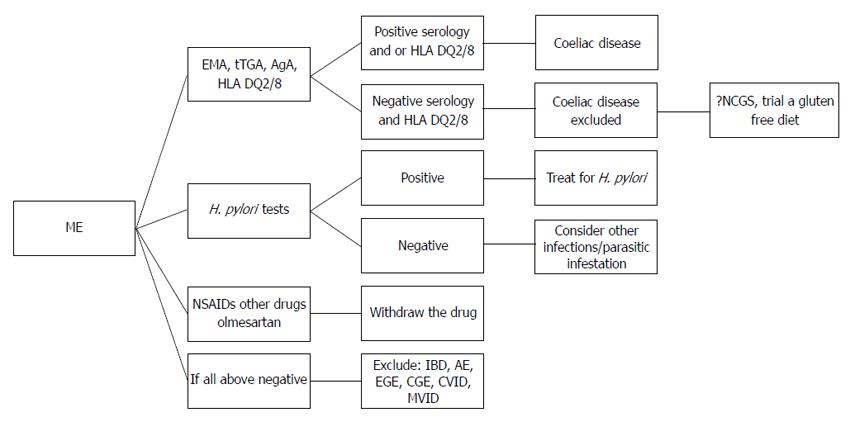
Figure 2 Algorithm for diagnosis the underlying condition behind microscopic enteritis.
HLA: Human leucocyte antigen; EMA: Endomysial antibodies; tTGA: Tissue transglutaminase antibodies; AgA: Antigliadin antibodies; NCGS: Non coeliac gluten sensitivity; NSAIDs: Non-steroidal anti-inflammatory drugs; IBD: Inflammatory bowel disease; AE: Autoimmune enteropathy; EGE: Eosinophilic gastroenteritis; CVID: Common variable immunodeficiency; CGE: Collageneous gastroenteritis; MVID: Microvillous inclusion disease; H. pylori: Helicobacter pylori.
- Citation: Rostami K, Aldulaimi D, Holmes G, Johnson MW, Robert M, Srivastava A, Fléjou JF, Sanders DS, Volta U, Derakhshan MH, Going JJ, Becheanu G, Catassi C, Danciu M, Materacki L, Ghafarzadegan K, Ishaq S, Rostami-Nejad M, Peña AS, Bassotti G, Marsh MN, Villanacci V. Microscopic enteritis: Bucharest consensus. World J Gastroenterol 2015; 21(9): 2593-2604
- URL: https://www.wjgnet.com/1007-9327/full/v21/i9/2593.htm
- DOI: https://dx.doi.org/10.3748/wjg.v21.i9.2593


