Copyright
©The Author(s) 2015.
World J Gastroenterol. Feb 28, 2015; 21(8): 2510-2521
Published online Feb 28, 2015. doi: 10.3748/wjg.v21.i8.2510
Published online Feb 28, 2015. doi: 10.3748/wjg.v21.i8.2510
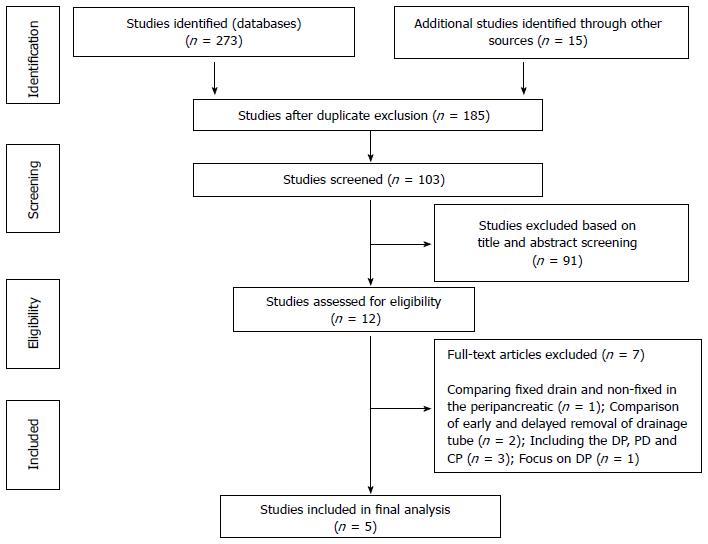
Figure 1 Flow diagram depicting the study selection.
CP: Central pancreatectomy; DP: Distal pancreatectomy; PD: Pancreaticoduodenectomy.
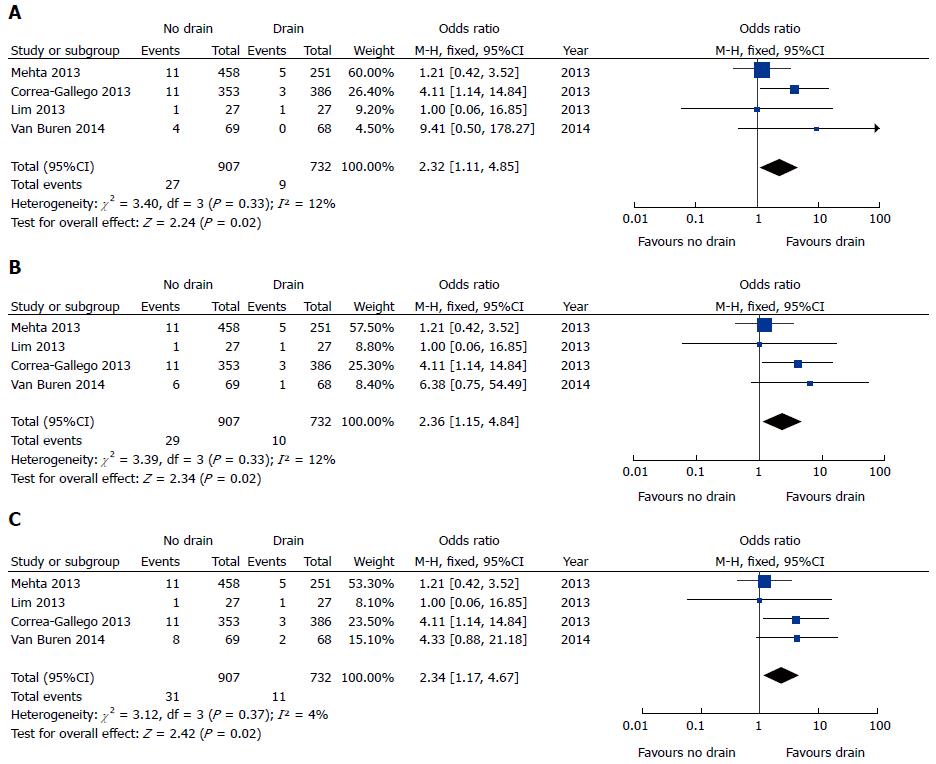
Figure 2 Forest plots illustrating meta-analysis of primary outcomes comparing drain with no drain after pancreaticoduodenectomy.
Pooled odds ratios (ORs) with 95%CIs were calculated using the fixed effects models to analyze outcomes at A: 30 d; B: 60 d; and C: 90 d.
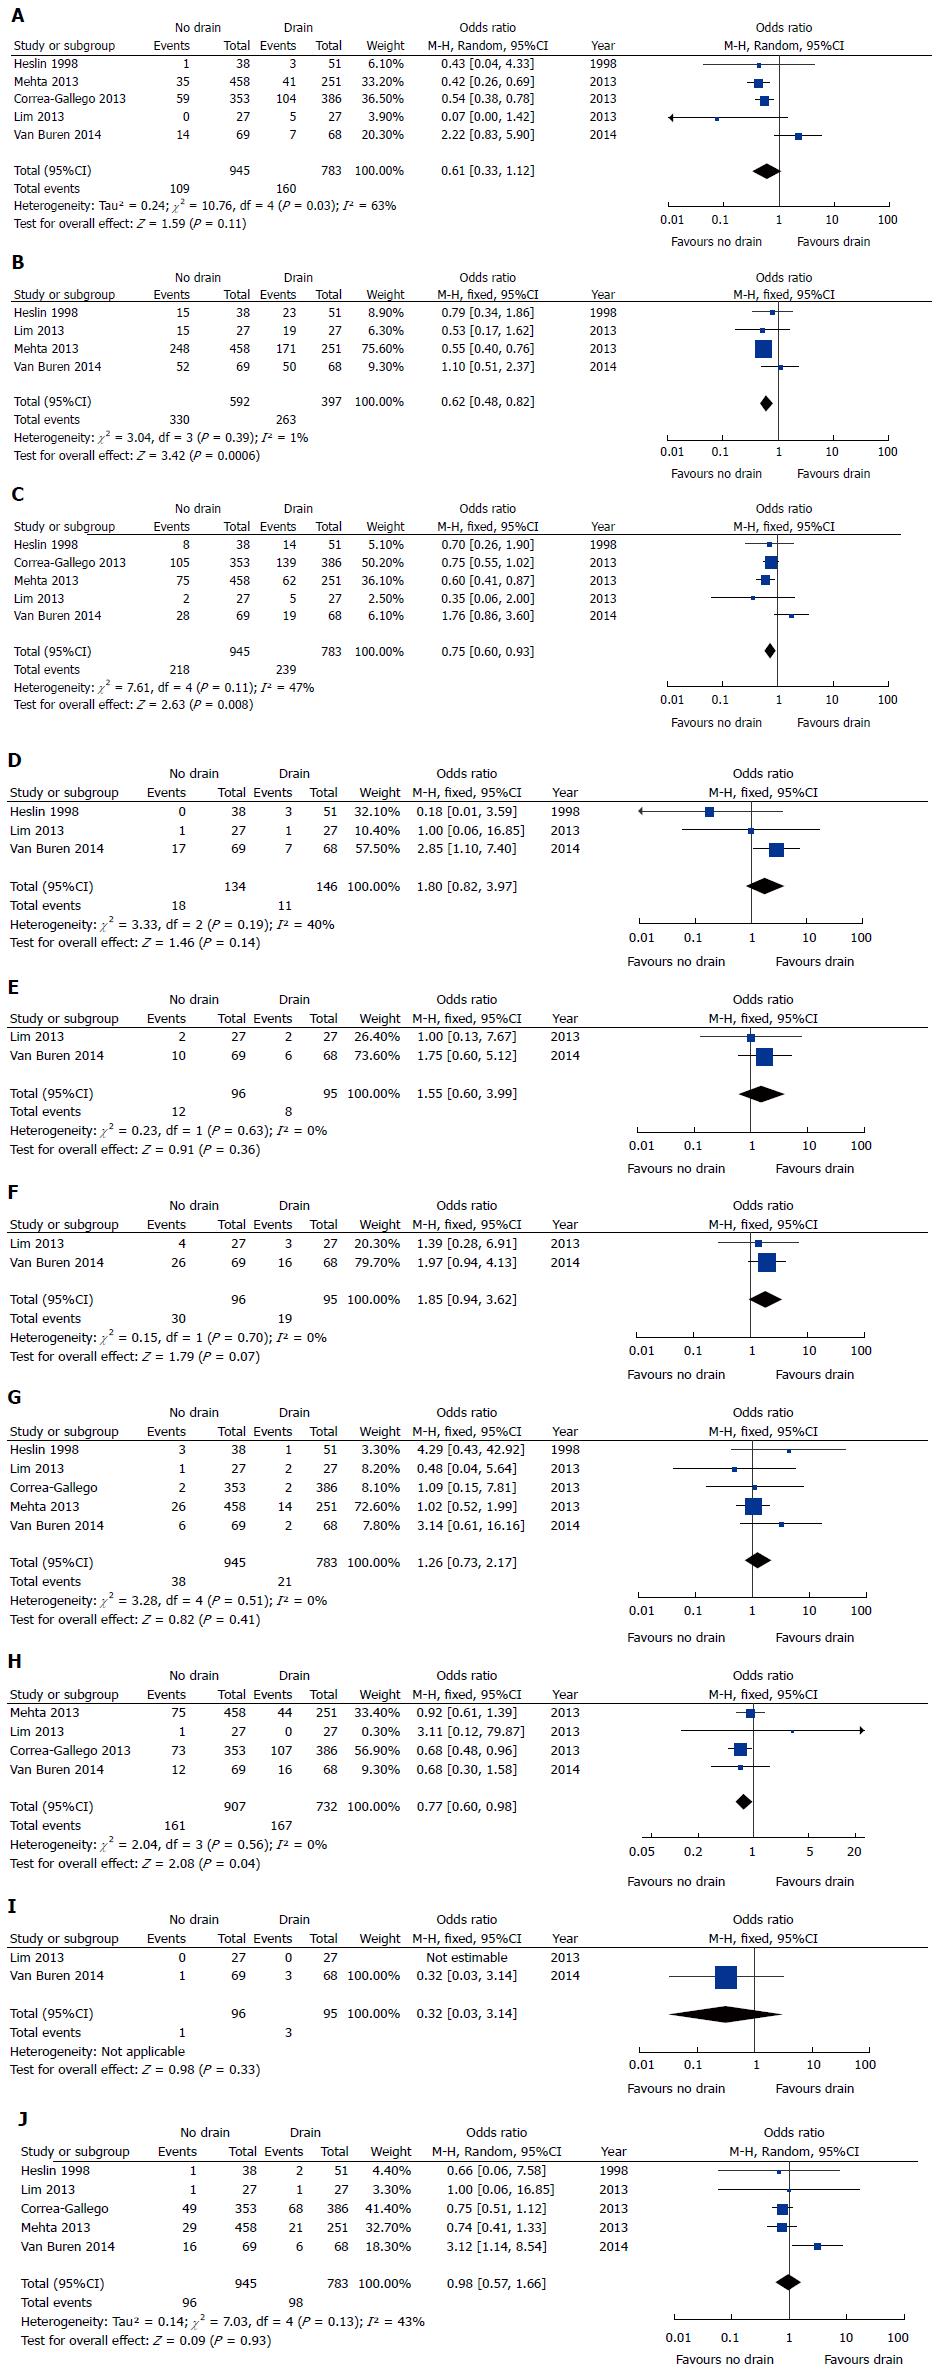
Figure 3 Forest plots illustrating meta-analysis of secondary outcomes comparing drain with no drain after pancreaticoduodenectomy.
Pooled odds ratios (ORs) with 95%CIs were calculated using fixed or random effects models to analyze outcomes at 30 d. A: Pancreatic fistula; B: Overall complications; C: Major complications; D: Intra-abdominal abscess; E: Postoperative hemorrhage; F: Delayed gastric emptying; G: Reoperation; H: Readmission; I: Biliary fistula; J: Radiologic-guided drain.
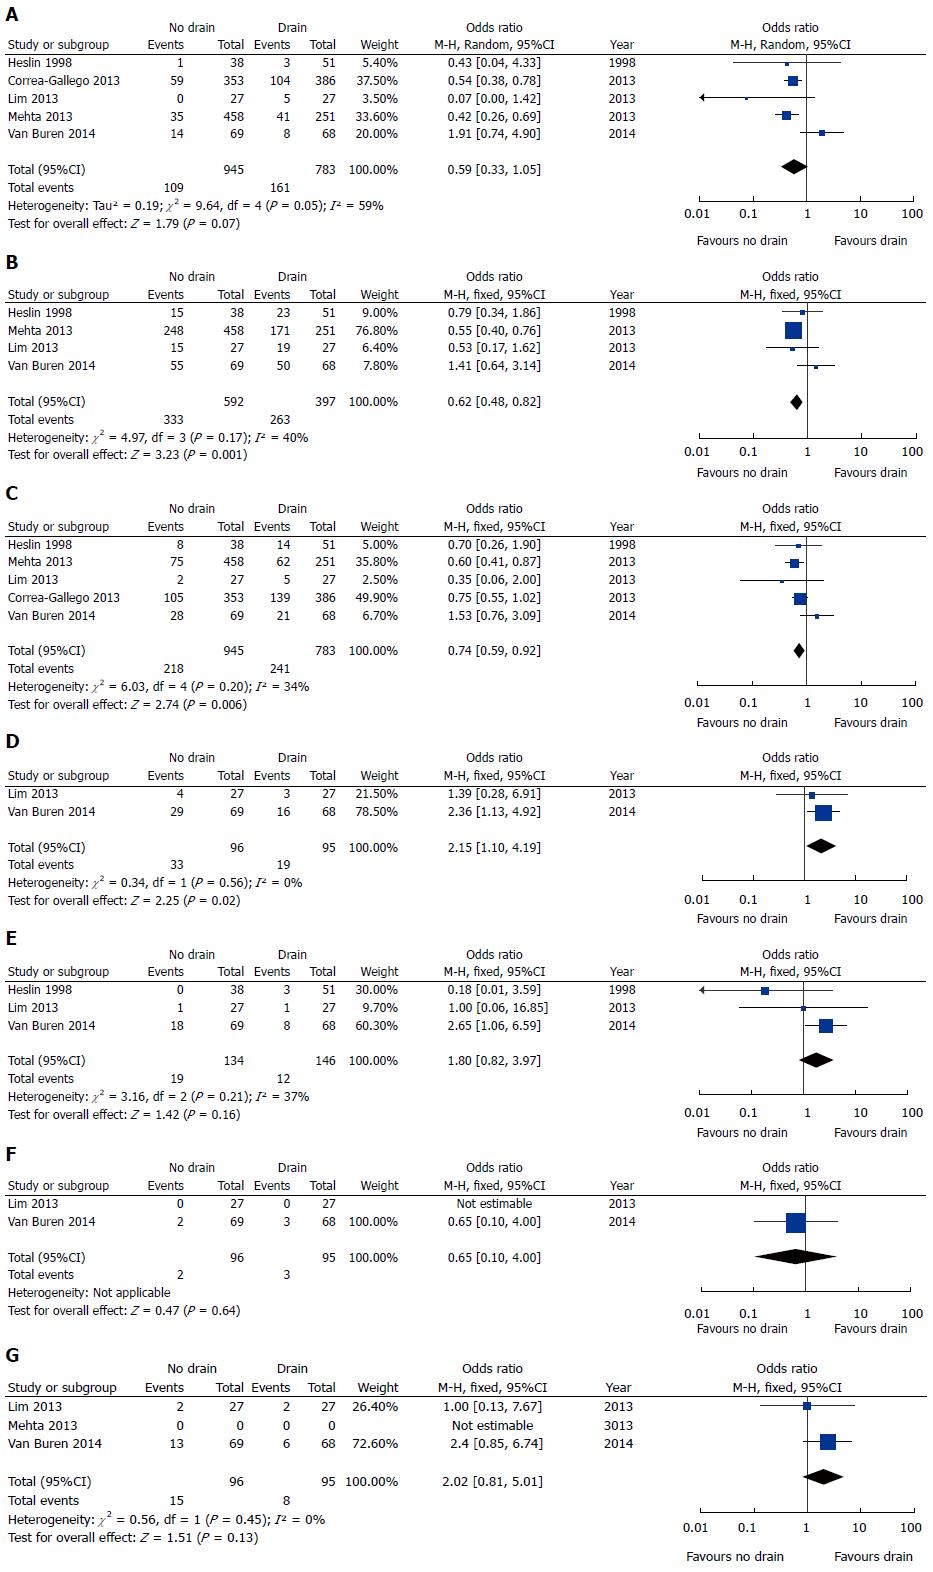
Figure 4 Forest plots illustrating meta-analysis of secondary outcomes comparing drain with no drain after pancreaticoduodenectomy.
Pooled odds ratios (ORs) with 95%CIs were calculated using fixed or random effects models to analyze outcomes at 60 d. A: Pancreatic fistula; B: Overall complications; C: Major complications; D: Delayed gastric emptying; E: Intra-abdominal abscess; F: Biliary fistula; G: Postoperative hemorrhage.
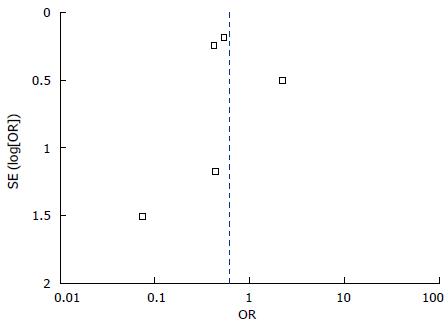
Figure 5 Funnel plot to investigate publication bias.
- Citation: Wang YC, Szatmary P, Zhu JQ, Xiong JJ, Huang W, Gomatos I, Nunes QM, Sutton R, Liu XB. Prophylactic intra-peritoneal drain placement following pancreaticoduodenectomy: A systematic review and meta-analysis. World J Gastroenterol 2015; 21(8): 2510-2521
- URL: https://www.wjgnet.com/1007-9327/full/v21/i8/2510.htm
- DOI: https://dx.doi.org/10.3748/wjg.v21.i8.2510


