Copyright
©The Author(s) 2015.
World J Gastroenterol. Feb 14, 2015; 21(6): 1938-1944
Published online Feb 14, 2015. doi: 10.3748/wjg.v21.i6.1938
Published online Feb 14, 2015. doi: 10.3748/wjg.v21.i6.1938
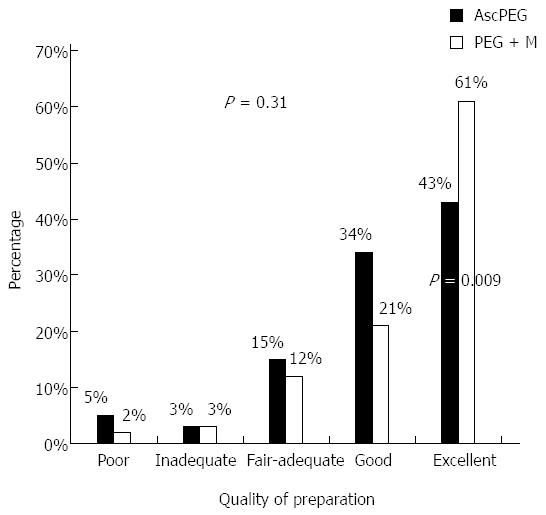
Figure 1 Quality of bowel preparation on the modified Aronchick scale.
P-value for the difference between AscPEG and PEG + M Aronchick scores is 0.31; P-value for the difference between excellent results with PEG + M and AscPEG is 0.009. PEG + M: PEG electrolyte solution + menthol; AscPEG: Ascorbic acid PEG electrolyte solution.
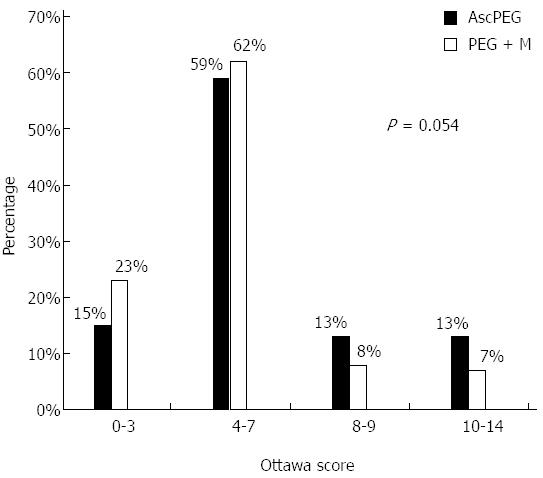
Figure 2 Overall preparation score according to the Ottawa score (a lower score indicates a better preparation).
P-value for the difference between AscPEG and PEG + M Ottawa scores is 0.054. PEG + M: PEG electrolyte solution + menthol; AscPEG: Ascorbic acid PEG electrolyte solution.
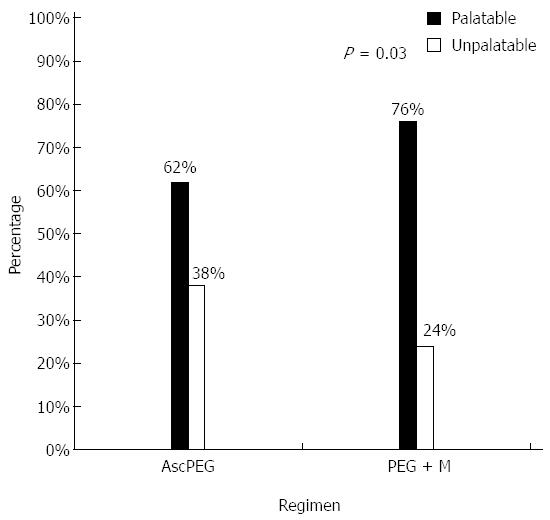
Figure 3 Palatability of the colon preparation (score ≤ 3: Unpalatable; 4 or 5: Palatable).
P-value for the difference in palatability between AscPEG and PEG + M is 0.03. PEG + M: PEG electrolyte solution + menthol; AscPEG: Ascorbic acid PEG electrolyte solution.
-
Citation: Sharara AI, Harb AH, Sarkis FS, Chalhoub JM, Badreddine R, Mourad FH, Othman M, Masri O. Split-dose menthol-enhanced PEG
vs PEG-ascorbic acid for colonoscopy preparation. World J Gastroenterol 2015; 21(6): 1938-1944 - URL: https://www.wjgnet.com/1007-9327/full/v21/i6/1938.htm
- DOI: https://dx.doi.org/10.3748/wjg.v21.i6.1938


