Copyright
©The Author(s) 2015.
World J Gastroenterol. Feb 14, 2015; 21(6): 1915-1926
Published online Feb 14, 2015. doi: 10.3748/wjg.v21.i6.1915
Published online Feb 14, 2015. doi: 10.3748/wjg.v21.i6.1915
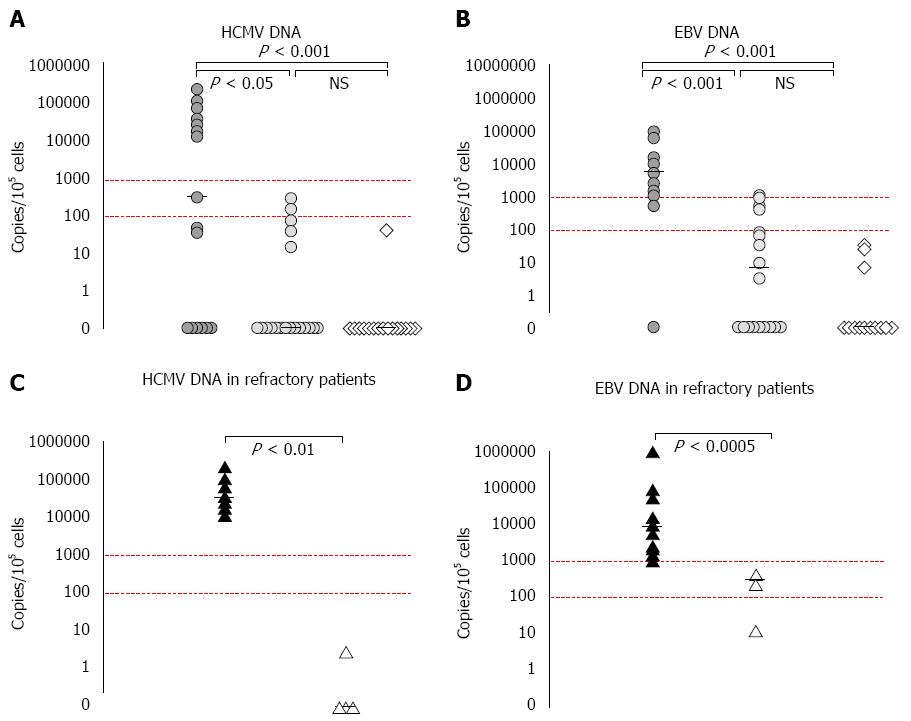
Figure 1 Refractory inflammatory bowel disease patients (full circles) showed statistically significant higher values in comparison with non-refractory patients (empty circles) and controls (empty rhombuses; panels A and B).
A peculiar distribution is observed with non-refractory patients displaying values always below 103 and controls below 102 copies/105 cells (red dotted lines). Within the refractory group, the macroscopically diseased areas (full triangles) carried DNA viral loads invariably over 103 copies/105 cells compared to non-diseased mucosa (empty triangles; panels C and D). The black bars indicate the median values. NS: Not significant; HCMV: Human Cytomegalovirus; EBV: Epstein-Barr virus.
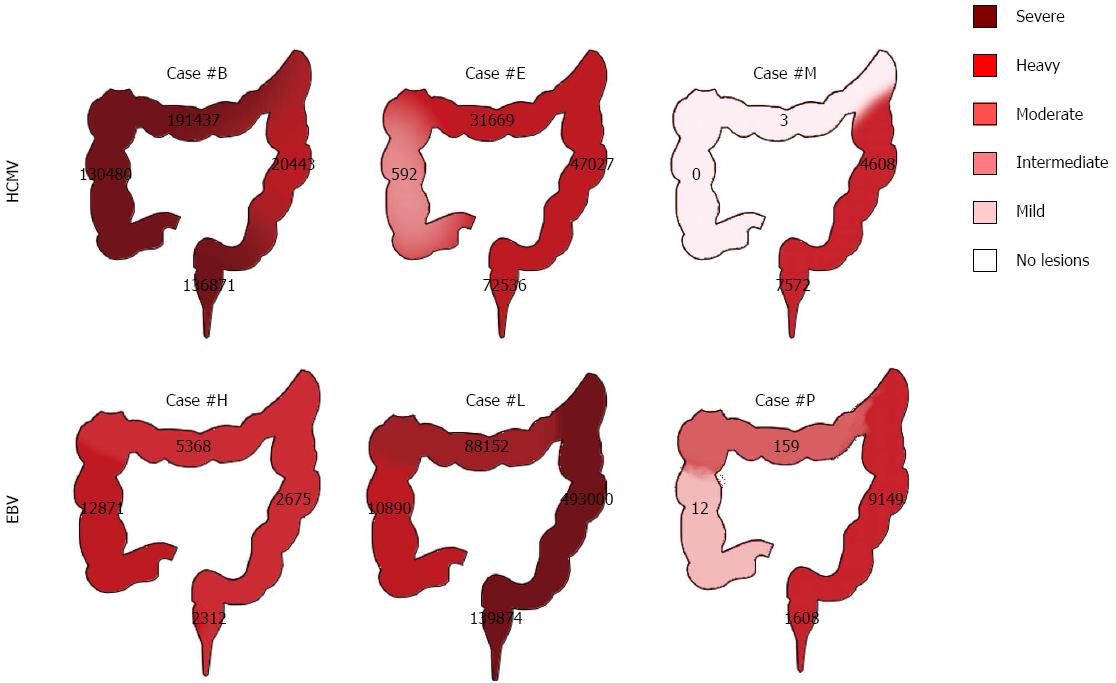
Figure 2 Six representative refractory patients with Human Cytomegalovirus - upper panels - and Epstein-Barr virus - lower panels - superimposed colitis.
The distribution of the DNA viral loads (given as number of copies/105 cells) along the colon perfectly matches the distribution and severity of mucosal lesions as shown by the arbitrary red scale. HCMV: Human Cytomegalovirus; EBV: Epstein-Barr virus.
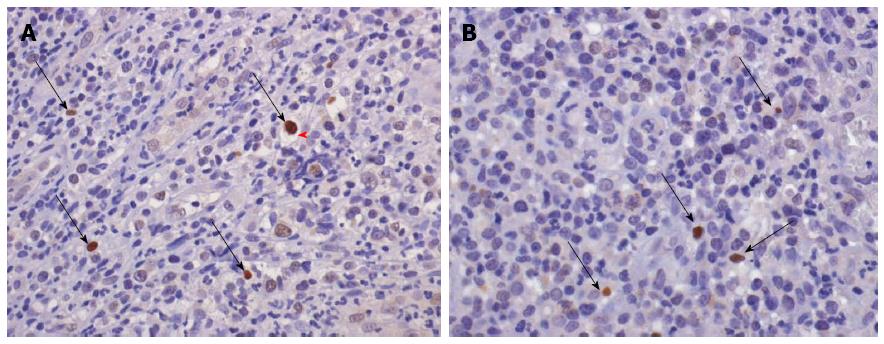
Figure 3 Pathognomonic “cytomegalic” cell (i.
e., enlarged cell surrounded by a light-coloured halo, red arrow) with a brown reactive nuclear inclusion (thin black arrows) and a few scattered positive cells for the human Cytomegalovirus are shown (panel A, immunoperoxidase-hematoxylin, original magnification × 250). Some positive cells with brown nuclei (thin black arrows) are evident following the specific staining for the Epstein-Barr virus nuclear antigen-1 (panel B, immunoperoxidase-hematoxylin, original magnification × 400).
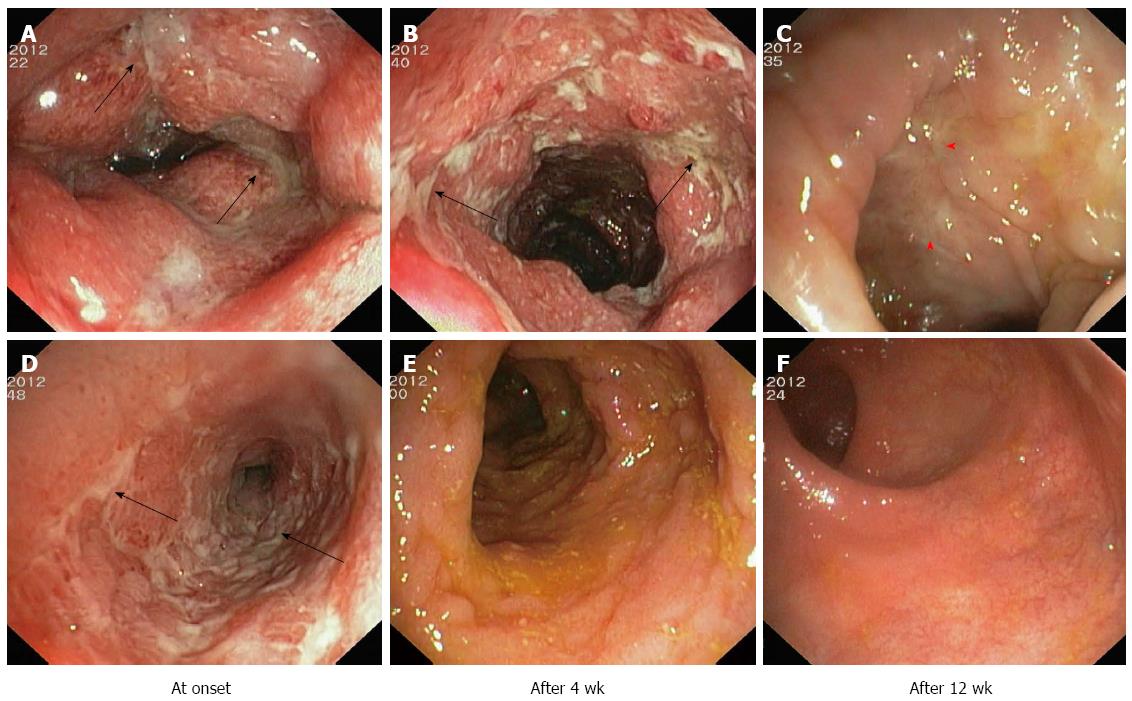
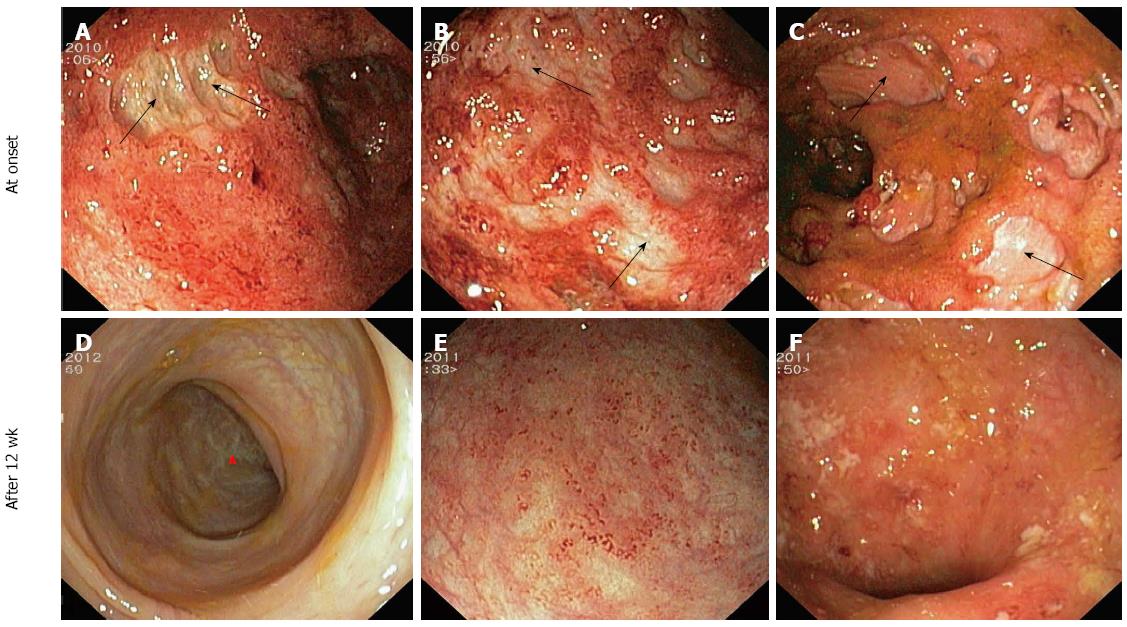
Figure 4 Presence of profound, round and longitudinal ulcers covered by a fibrino-purulent exudate (black arrows) and embedded in edematous and erythematous mucosa are clearly evident (panels A and D).
The healing process, usually observed after three months from the end of specific antiviral therapy, may result in both white scars (red arrows, panel C) or restitution ad integrum (panel F), passing through a phase of slight improvement (panels B and E).
Figure 5 Presence of holes in the mucosa with exposure of the underlying muscular layer (black arrows), surrounded by granular and spontaneously bleeding zones, is clearly evident (panels A to C).
After a three-month washout period from any therapy for the primary disease, the healing process with white scars (red arrow) was observed in the only patient who underwent a cycle with rituximab (panel D), whilst a slight or no improvement was observed in the other two representative cases.
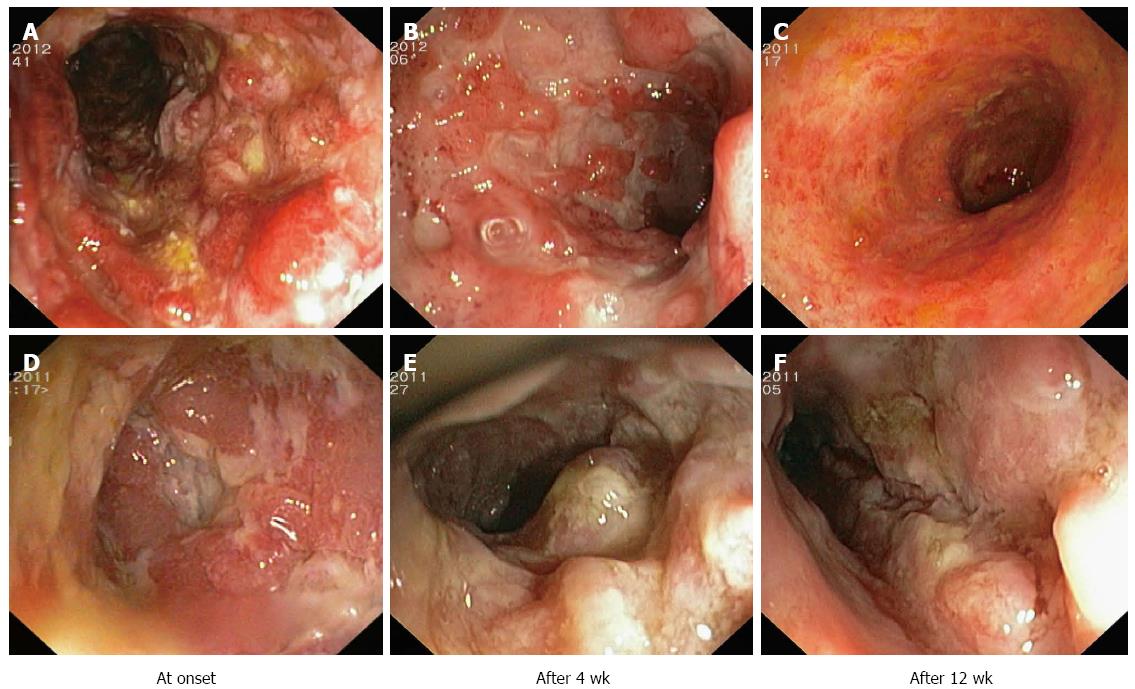
Figure 6 Severe lesions characterized by a pronounced, nodular-cobblestone appearance, punctuated by multiple, deep ulcerations (panels A, B, D, E), which did not heal (panels C, F), were found in those refractory patients with high DNA loads of both viruses.
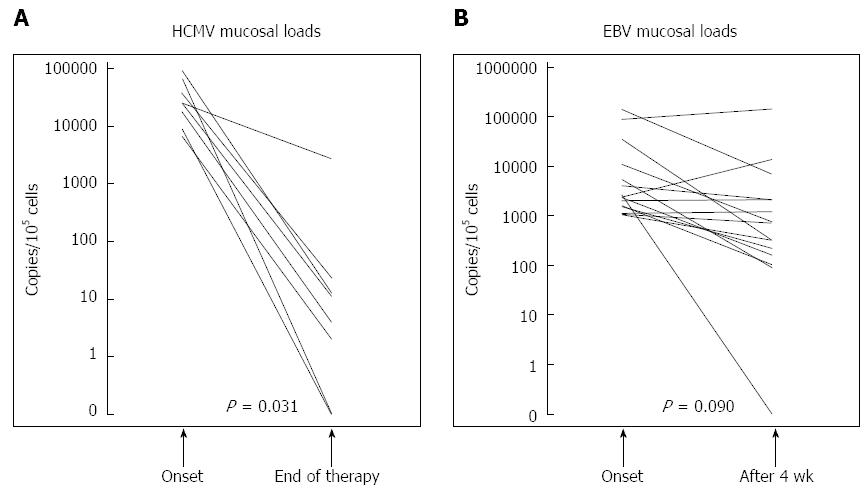
Figure 7 Median values of human Cytomegalovirus (panel A) and Epstein Barr virus (panel B) DNA levels of each refractory patient at onset and at the end of antiviral therapy in human Cytomegalovirus cases, and at four weeks after washout or reduction of current treatment in patients with Epstein-Barr virus infection.
A dramatic decrease of mucosal viral loads was observed in all patients with HCMV colitis, except one who continued steroid therapy while taking ganciclovir. By contrast, no modification of mucosal viral load values was observed in any patient with EBV colitis, except the one who underwent a cycle of therapy with rituximab. HCMV: Human Cytomegalovirus; EBV: Epstein Barr virus.
- Citation: Ciccocioppo R, Racca F, Paolucci S, Campanini G, Pozzi L, Betti E, Riboni R, Vanoli A, Baldanti F, Corazza GR. Human cytomegalovirus and Epstein-Barr virus infection in inflammatory bowel disease: Need for mucosal viral load measurement. World J Gastroenterol 2015; 21(6): 1915-1926
- URL: https://www.wjgnet.com/1007-9327/full/v21/i6/1915.htm
- DOI: https://dx.doi.org/10.3748/wjg.v21.i6.1915


