Copyright
©The Author(s) 2015.
World J Gastroenterol. Feb 14, 2015; 21(6): 1707-1717
Published online Feb 14, 2015. doi: 10.3748/wjg.v21.i6.1707
Published online Feb 14, 2015. doi: 10.3748/wjg.v21.i6.1707
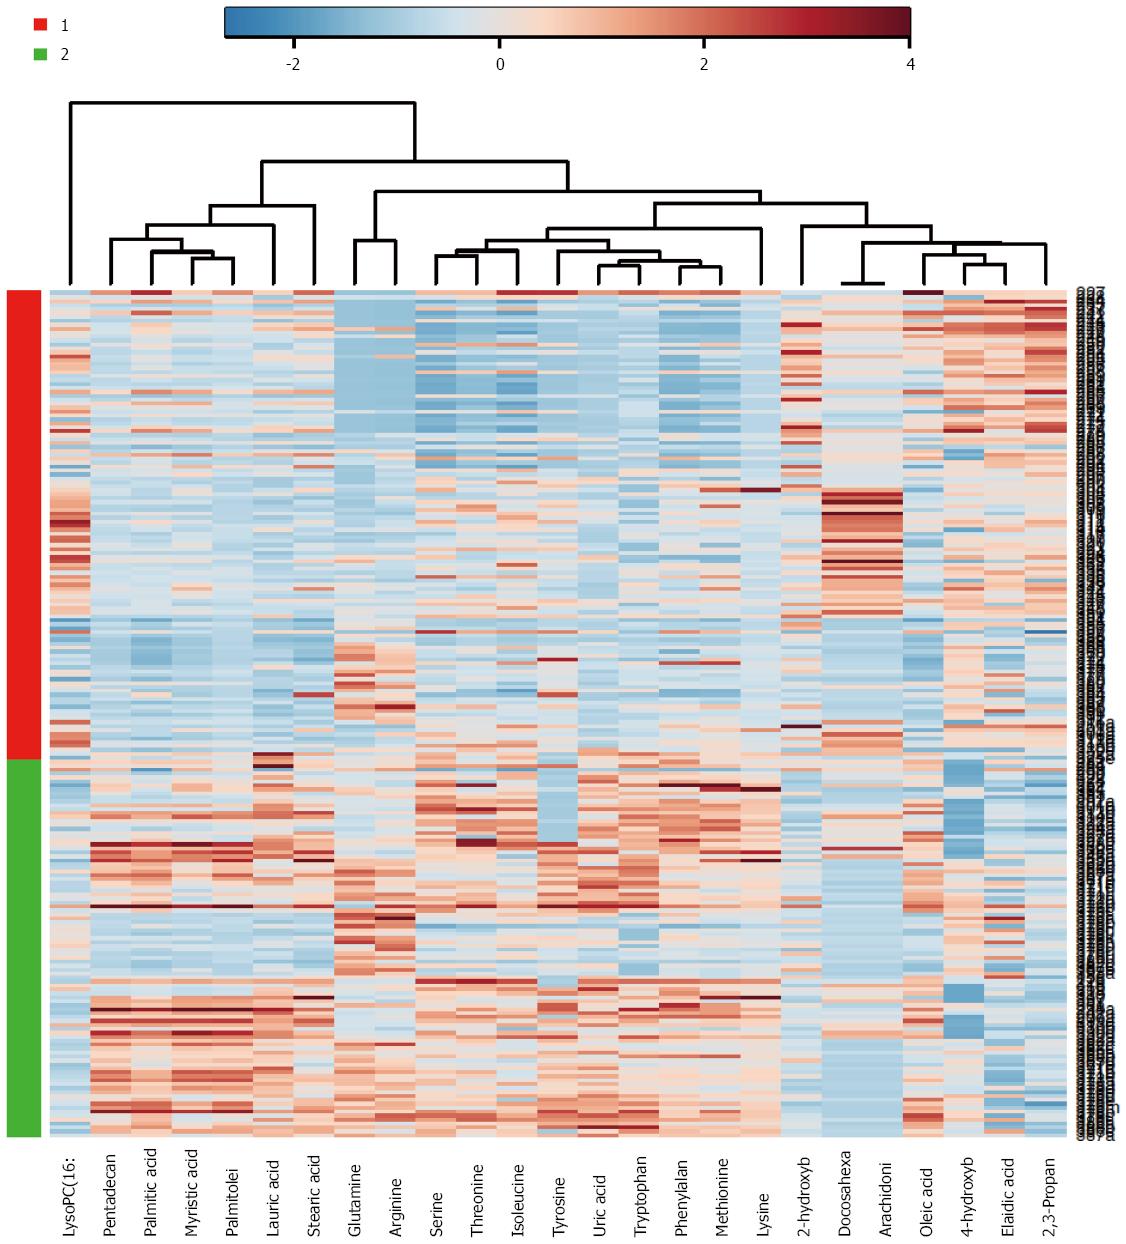
Figure 1 Example of metabolomics based analysis, allowing segregation of pancreatic ductal adenocarcinoma from benign cases.
Heat map illustration of discriminant capability of a metabolite set derived from gas chromatography and liquid chromatography/mass spectrometry plasma metabolomics dataset comparing pancreatic ductal adenocarcinoma patients (Red or group 1; n = 110) and benign pancreas (includes benign cysts, chronic pancreatitis, and normal pancreas) (Green or group 2; n = 90). Metabolites are plotted on x-axis, and the cases on the y-axis. Blue color indicates data points with a value smaller than the median of the respective metabolite and the red indicates higher values. This candidate set of metabolites enabled the segregation of the two groups.
- Citation: Urayama S. Pancreatic cancer early detection: Expanding higher-risk group with clinical and metabolomics parameters. World J Gastroenterol 2015; 21(6): 1707-1717
- URL: https://www.wjgnet.com/1007-9327/full/v21/i6/1707.htm
- DOI: https://dx.doi.org/10.3748/wjg.v21.i6.1707


