Copyright
©The Author(s) 2015.
World J Gastroenterol. Feb 7, 2015; 21(5): 1641-1649
Published online Feb 7, 2015. doi: 10.3748/wjg.v21.i5.1641
Published online Feb 7, 2015. doi: 10.3748/wjg.v21.i5.1641
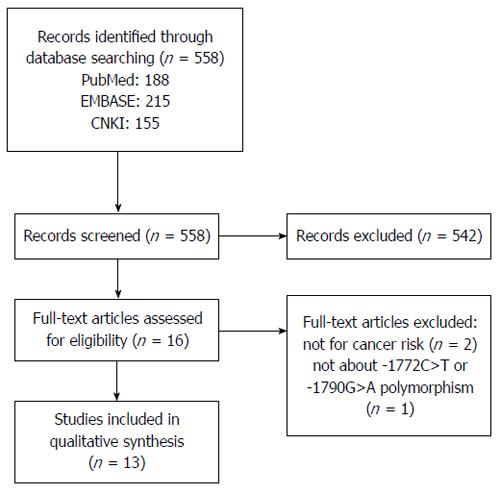
Figure 1 Flow chart of study selection.
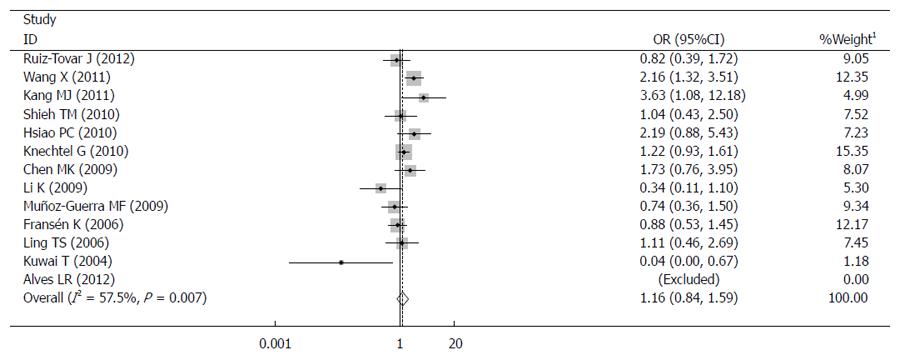
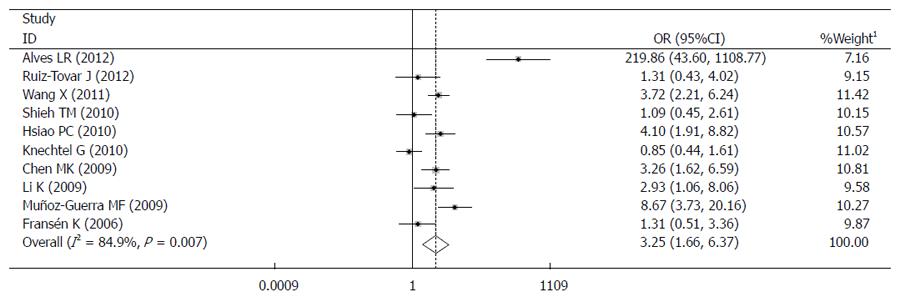
Figure 2 Forrest plot of the -1772C>T polymorphism and the risk of digestive tract cancer.
1Weights are from random effects analysis. Dominant comparison: TT + CT vs CC. OR: Odds ratio.
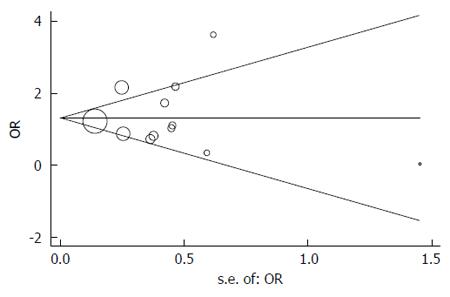
Figure 3 Begg’s funnel plot with pseudo 95% confidence limits.
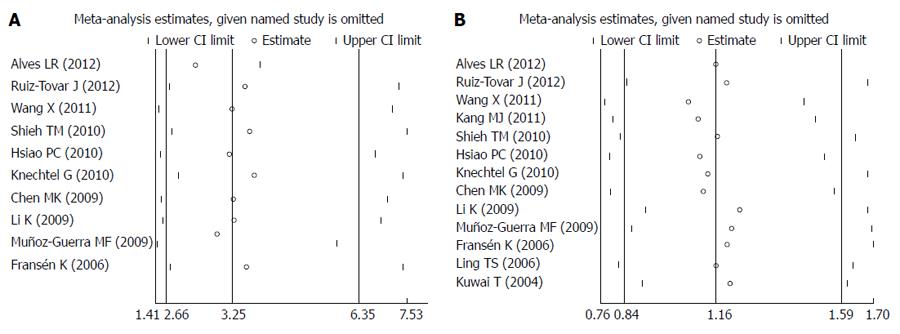
Figure 4 Meta-analysis estimates, with given named study omitted (A, B).
Figure 5 Forrest plot of the -1790G>A polymorphism and the risk of digestive tract cancer.
1Weights are from random effects analysis. Dominant comparison: AA + GA vs GG.
- Citation: Sun X, Liu YD, Gao W, Shen SH, Li M. HIF-1α -1790G>A polymorphism significantly increases the risk of digestive tract cancer: A meta-analysis. World J Gastroenterol 2015; 21(5): 1641-1649
- URL: https://www.wjgnet.com/1007-9327/full/v21/i5/1641.htm
- DOI: https://dx.doi.org/10.3748/wjg.v21.i5.1641


