Copyright
©The Author(s) 2015.
World J Gastroenterol. Feb 7, 2015; 21(5): 1621-1627
Published online Feb 7, 2015. doi: 10.3748/wjg.v21.i5.1621
Published online Feb 7, 2015. doi: 10.3748/wjg.v21.i5.1621
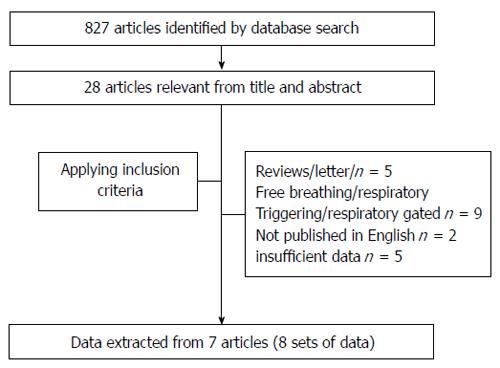
Figure 1 Flow chart for articles identified and included in this meta-analysis.
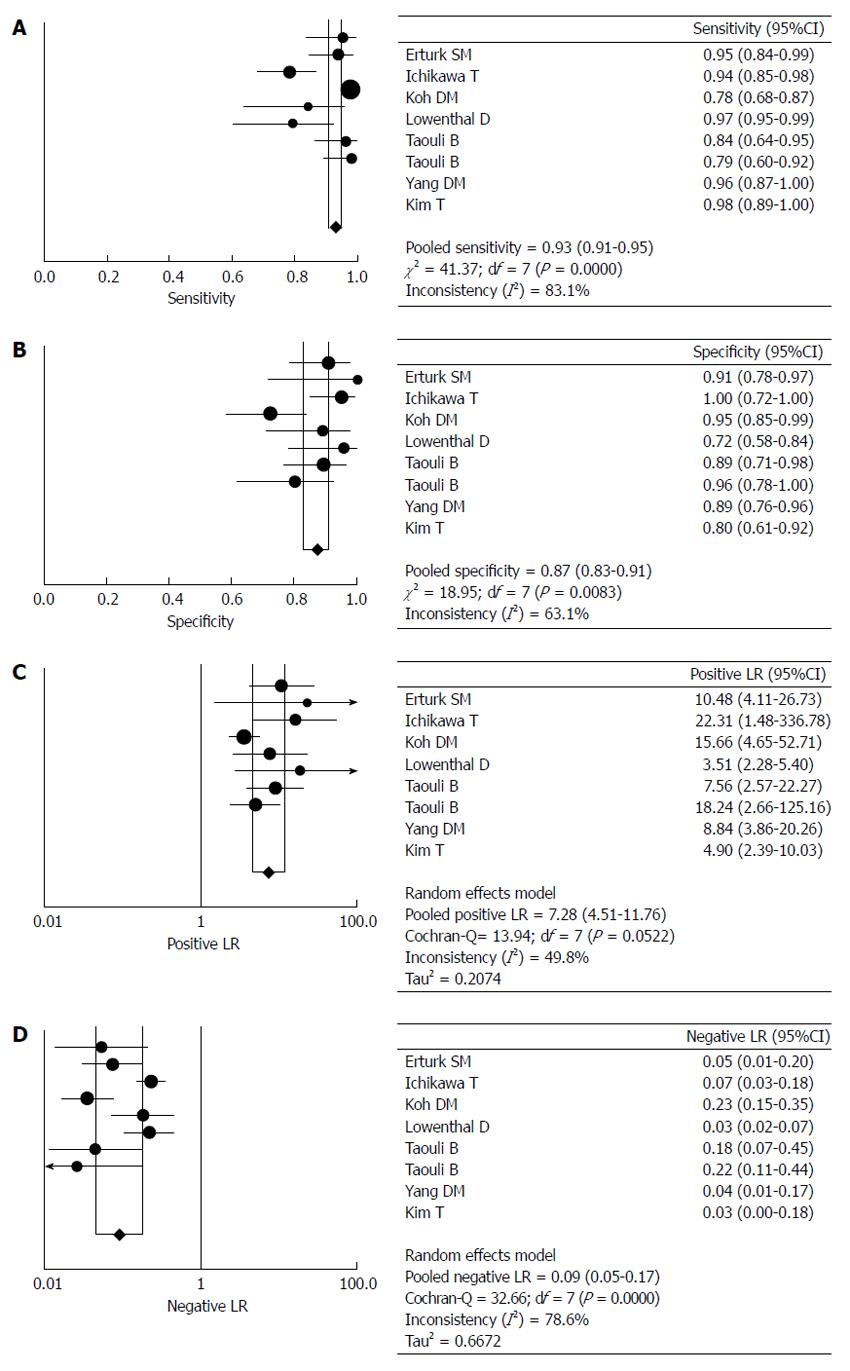
Figure 2 Forest plots.
A: Sensitivity; B: Specificity; C: Positive likelihood ratio (LR); and D: Negative LR. CI: Confidence interval.
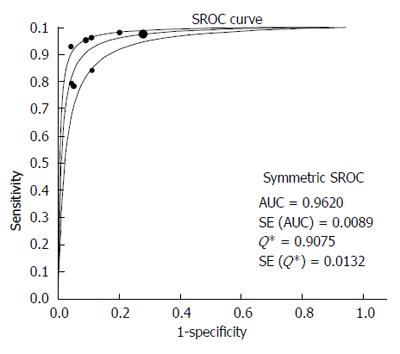
Figure 3 Summary receiver operating characteristics curve.
Sensitivity and specificity are plotted for individual studies. AUC: Area under the curve. SROC: Summary receiver operating characteristics.
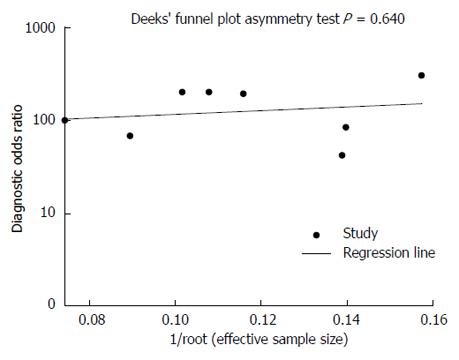
Figure 4 There is no significant publication bias.
- Citation: Chen ZG, Xu L, Zhang SW, Huang Y, Pan RH. Lesion discrimination with breath-hold hepatic diffusion-weighted imaging: A meta-analysis. World J Gastroenterol 2015; 21(5): 1621-1627
- URL: https://www.wjgnet.com/1007-9327/full/v21/i5/1621.htm
- DOI: https://dx.doi.org/10.3748/wjg.v21.i5.1621


