Copyright
©The Author(s) 2015.
World J Gastroenterol. Feb 7, 2015; 21(5): 1573-1579
Published online Feb 7, 2015. doi: 10.3748/wjg.v21.i5.1573
Published online Feb 7, 2015. doi: 10.3748/wjg.v21.i5.1573
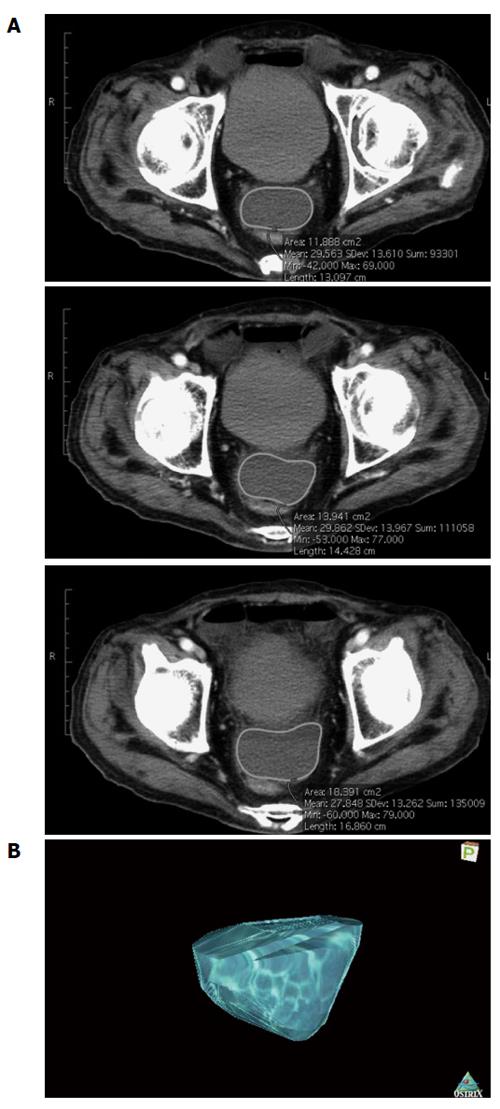
Figure 1 Representative construction of a 3D image of ascites by OsiriX.
A: Consecutive computed tomography slices were used for measurement. Intra-abdominal ascites are outlined in each slice; B: 3D image of ascites constructed with OsiriX software.
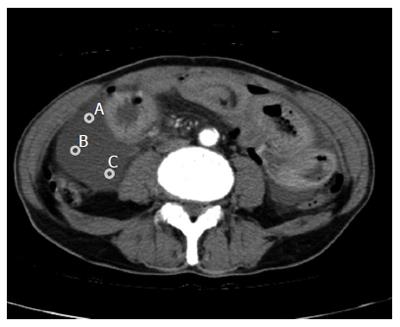
Figure 2 Representative measurements of computed tomography attenuation values by the 2D method.
The CT attenuation values of three arbitrary points on the ascites (A, B and C in the CT slice) were measured, and the mean value was calculated. CT: Computed tomography.
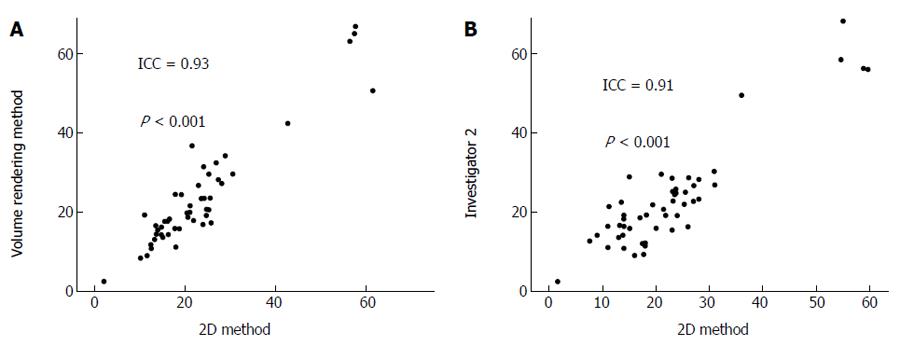
Figure 3 Evaluation of the reproducibility of the 2D method.
A: Correlation between the CT attenuation values calculated by the volume rendering and 2D methods; B: Correlation between the CT attenuation values calculated by two investigators. ICC: Interclass correlation coefficient; CT: Computed tomography.
- Citation: Seishima R, Okabayashi K, Hasegawa H, Tsuruta M, Hoshino H, Yamada T, Kitagawa Y. Computed tomography attenuation values of ascites are helpful to predict perforation site. World J Gastroenterol 2015; 21(5): 1573-1579
- URL: https://www.wjgnet.com/1007-9327/full/v21/i5/1573.htm
- DOI: https://dx.doi.org/10.3748/wjg.v21.i5.1573


