Copyright
©The Author(s) 2015.
World J Gastroenterol. Feb 7, 2015; 21(5): 1531-1545
Published online Feb 7, 2015. doi: 10.3748/wjg.v21.i5.1531
Published online Feb 7, 2015. doi: 10.3748/wjg.v21.i5.1531
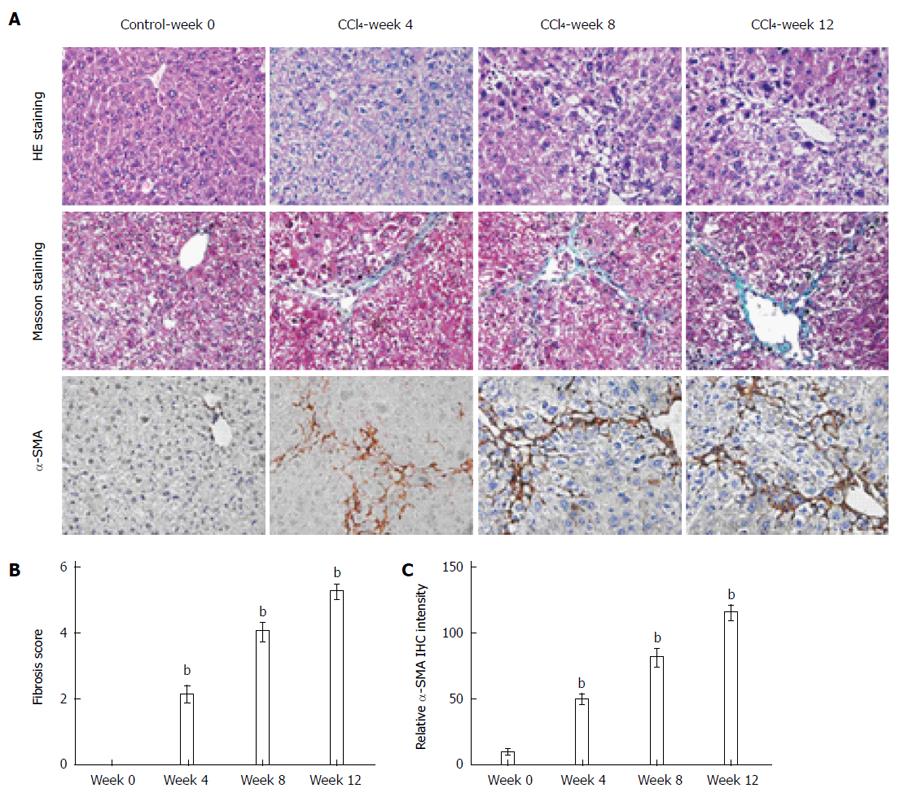
Figure 1 Degree of liver fibrosis in mice was evaluated by histopathological examination.
A: Histology was evaluated by hematoxylin and eosin (HE) staining and fibrillar collagen deposition was assessed by Masson staining (original magnification × 400). Activated hepatic stellate cells were evaluated in liver sections by immunohistochemical staining of alpha-smooth muscle actin (α-SMA) (original magnification × 400); B: Degree of liver fibrosis was assessed based on the Ishak scoring system; C: Morphometric quantitation of α-SMA expression. The mean number of α-SMA-positive cells in five ocular fields (magnification × 400) per specimen was assessed as a percentage area. bP < 0.01 vs the week 0 model group. Data are mean ± SD (n = 8-10).
Figure 2 Proportions of T helper 22, T helper 17 and T helper 1 cells were significantly increased in mice with hepatic fibrosis.
A-C: Representative images of T helper (Th)-22, Th17 and Th1 cells in the fibrosis group and the control group; D-F: The results of statistical analyses for the alterations in Th22, Th17 and Th1 cells in different subgroups; G-I: Correlation analyses of Th22 and Th17 cells, Th22 and Th1 cells, Th17 and Th1 cells in the fibrosis group at week 4. bP < 0.01 vs control subgroups sacrificed at the same time point; dP < 0.01 vs the other fibrosis subgroups. Data are mean ± SD (n = 8-10). ILs: Interleukins; IFN: Interferon.
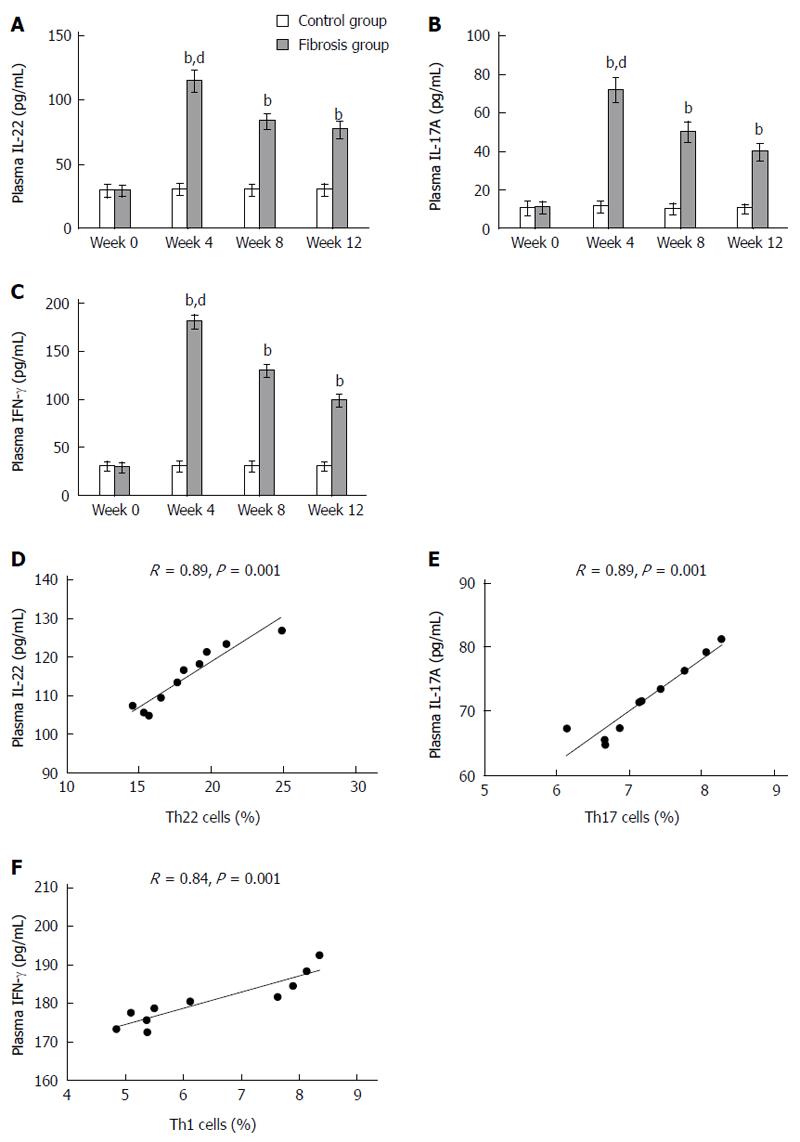
Figure 3 Elevated production of interleukin-22, interleukin-17A and interferon-γ protein in mice with hepatic fibrosis.
A-C: The results of statistical analyses for the alterations in interleukin (IL)-22, IL-17A and interferon (IFN)-γ in different subgroups; D-F: A positive correlation was found between T helper (Th)-22 cells and IL-22, Th17 cells and IL-17A, Th1 cells and IFN-γ in the fibrosis group at week 4. bP < 0.01 vs control subgroups sacrificed at the same time point; dP < 0.01 vs the other fibrosis subgroups. Data are mean ± SD (n = 8-10).
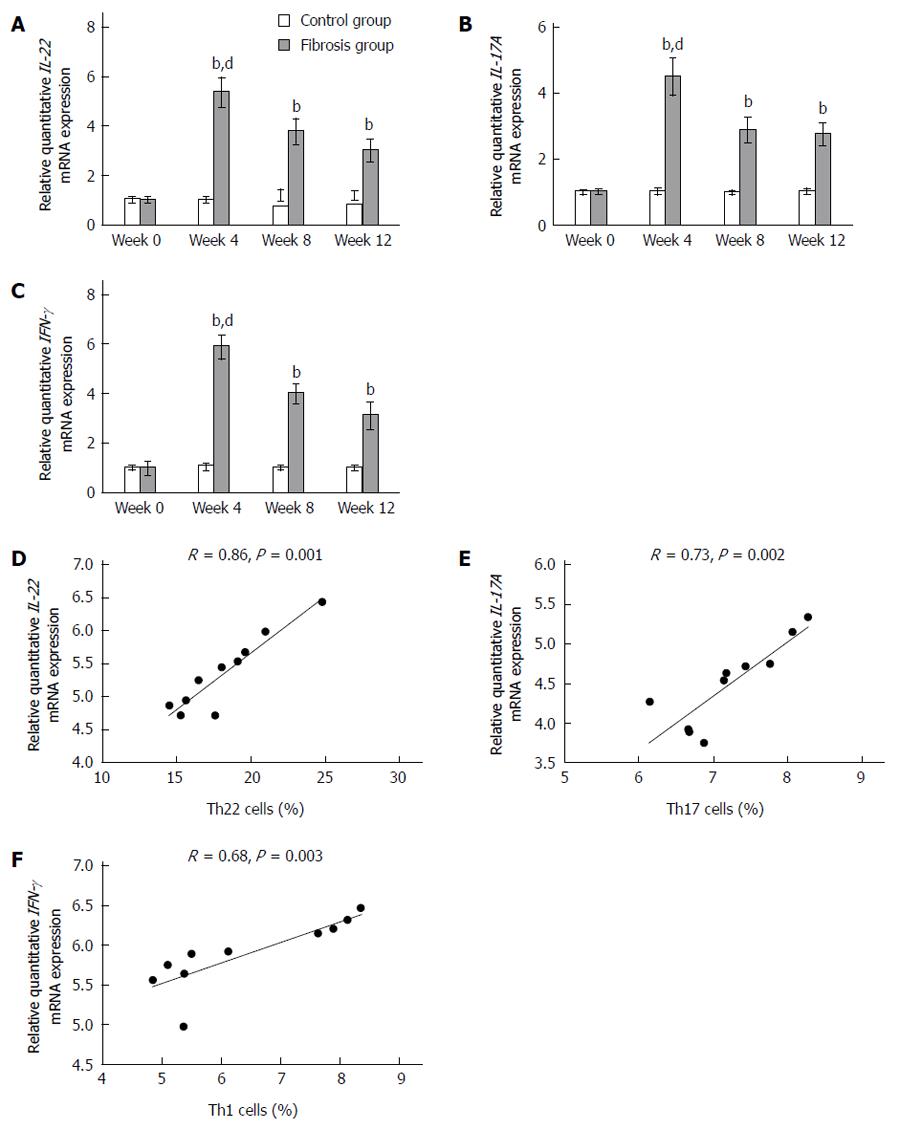
Figure 4 Elevated expression of interleukin-22, interleukin-17 and interferon-γ mRNA in mice with hepatic fibrosis.
A-C: The results of statistical analyses for the alterations in interleukin (IL)-22, IL-17 and interferon (IFN)-γ mRNA in different subgroups; D-F: A positive correlation was found between T helper (Th)-22 cells and IL-22 mRNA, Th17 cells and IL-17A mRNA, Th1 cells and IFN-γ mRNA in the fibrosis group at week 4. bP < 0.01 vs the control subgroups sacrificed at the same time point; dP < 0.01 vs the other fibrosis subgroups. Data are mean ± SD (n = 8-10).
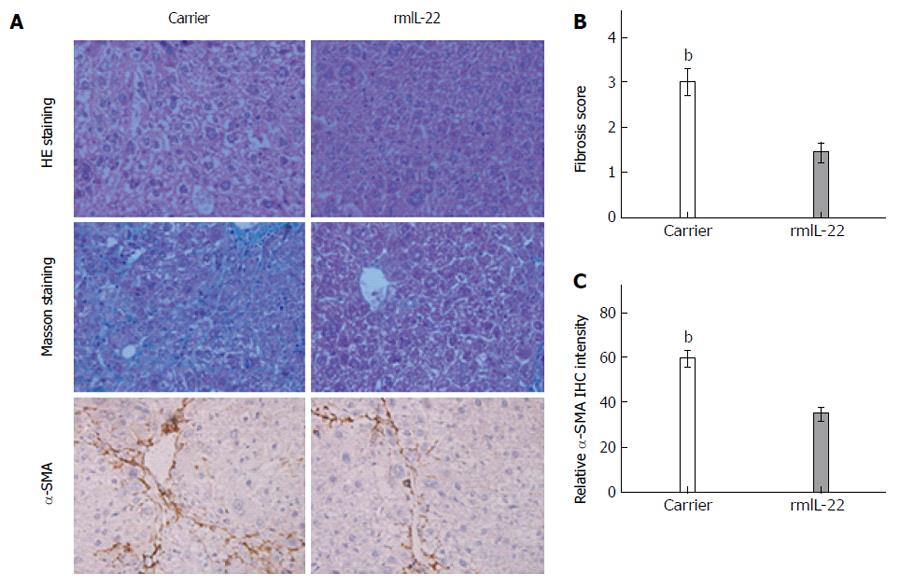
Figure 5 Recombinant IL-22 alleviated the severity of hepatic fibrosis.
A: Histology was assessed by hematoxylin and eosin (HE) staining and fibrillar collagen deposition was evaluated by Masson staining (original magnification × 400). Activated hepatic stellate cells were evaluated in liver sections by immunohistochemical staining of alpha-smooth muscle actin (α-SMA) (original magnification × 400); B: Degree of liver fibrosis was assessed based on the Ishak scoring system; C: Morphometric quantitation of α-SMA expression. bP < 0.01 vs the carrier group. Data are mean ± SD (n = 8). rmIL-22: Recombinant IL-22.
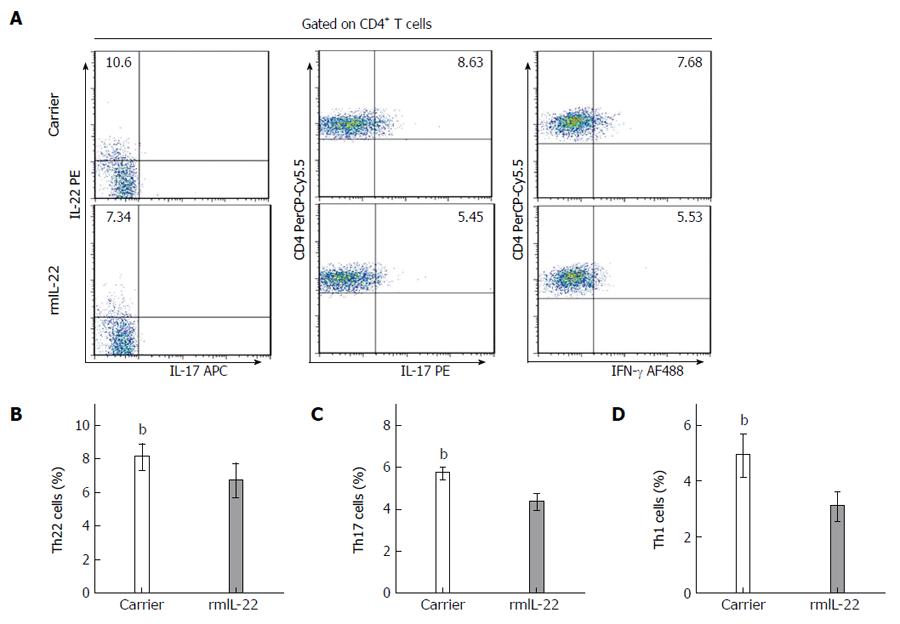
Figure 6 Recombinant-22 reduced the percentages of T helper 22, T helper 17 and T helper 1 cells.
A: Representative images of T helper (Th)-22, Th17 and Th1 cells in the recombinant (rmIL)-22 group and carrier group; B-D: The results of statistical analyses showed that the percentages of Th22, Th17 and Th1 cells in the rmIL-22 group were less than those in the carrier group. bP < 0.01 vs the carrier group. Data are mean ± SD (n = 8).
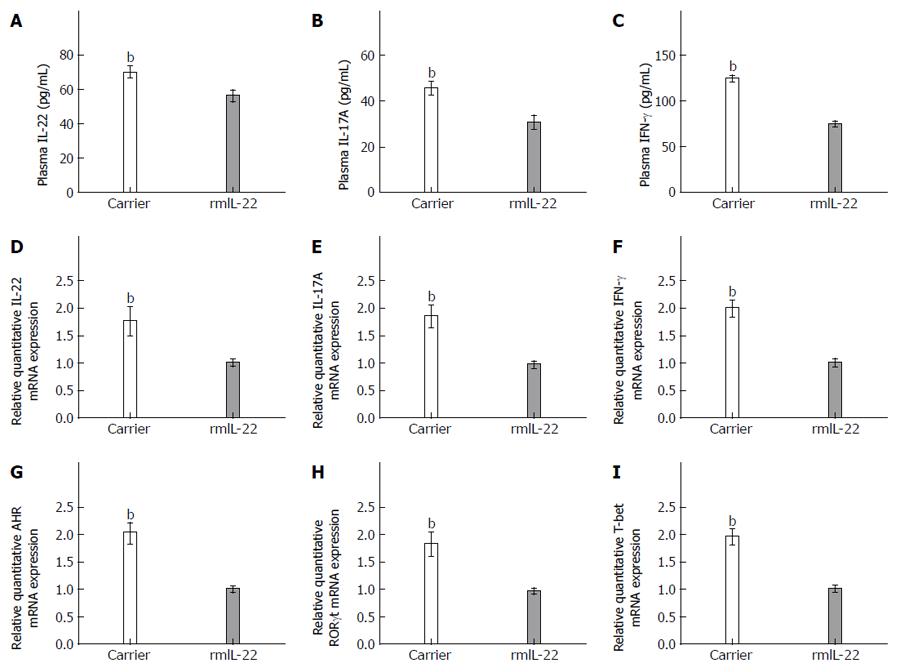
Figure 7 Expression of T helper 22-, T helper 17- and T helper 1-related cytokines was decreased in the recombinant interleukin-22 group.
A-C: The levels of plasma interleukin (IL)-22, IL-17A and interferon (IFN)-γ, measured by enzyme-linked immunosorbent assay, in the recombinant IL (rmIL)-22 group and the carrier group; D-I: The mRNA levels of liver IL-22, IL-17A, IFN-γ, aryl hydrocarbon receptor (AHR), retinoid-related orphan receptor γ (RORγt) and T-bet in the rmIL-22 group and the carrier group. bP < 0.01 vs the carrier group. Data are mean ± SD (n = 8).
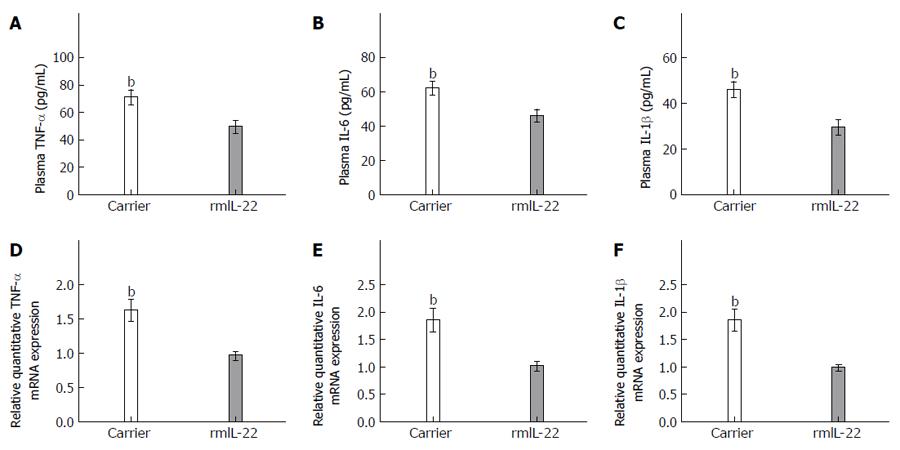
Figure 8 Recombinant interleukin-22 decreased the production of tumor necrosis factor-α, interleukin-6 and interleukin-1β.
The levels of tumor necrosis factor (TNF)-α (A), interleukin (IL)-6 (B) and IL-1β (C) circulating proteins were measured by enzyme-linked immunosorbent assay, and relative hepatic expression of mRNA was investigated by reverse transcription polymerase chain reaction in the recombinant IL (rmIL)-22 group and the carrier group (D-F), bP < 0.01 vs the carrier group. Data are mean ± SD (n = 8).
- Citation: Lu DH, Guo XY, Qin SY, Luo W, Huang XL, Chen M, Wang JX, Ma SJ, Yang XW, Jiang HX. Interleukin-22 ameliorates liver fibrogenesis by attenuating hepatic stellate cell activation and downregulating the levels of inflammatory cytokines. World J Gastroenterol 2015; 21(5): 1531-1545
- URL: https://www.wjgnet.com/1007-9327/full/v21/i5/1531.htm
- DOI: https://dx.doi.org/10.3748/wjg.v21.i5.1531


