Copyright
©The Author(s) 2015.
World J Gastroenterol. Dec 28, 2015; 21(48): 13438-13446
Published online Dec 28, 2015. doi: 10.3748/wjg.v21.i48.13438
Published online Dec 28, 2015. doi: 10.3748/wjg.v21.i48.13438
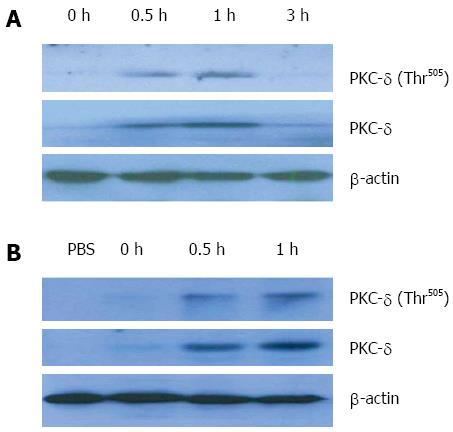
Figure 1 Protein kinase C-δ expression and activation (Thr505 phosphorylation) in liver tissue and peripheral blood mononuclear cells of mice with D-galactosamine/lipopolysaccharide-induced acute liver failure.
Acute liver failure was induced in BALB/c mice using D-galactosamine (600 mg/kg) and lipopolysaccharide (10 μg/kg). A: PKC-δ expression and Thr505 phosphorylation in liver tissue; B: PKC-δ expression and Thr505 phosphorylation in peripheral blood mononuclear cells. PKC: Protein kinase C.
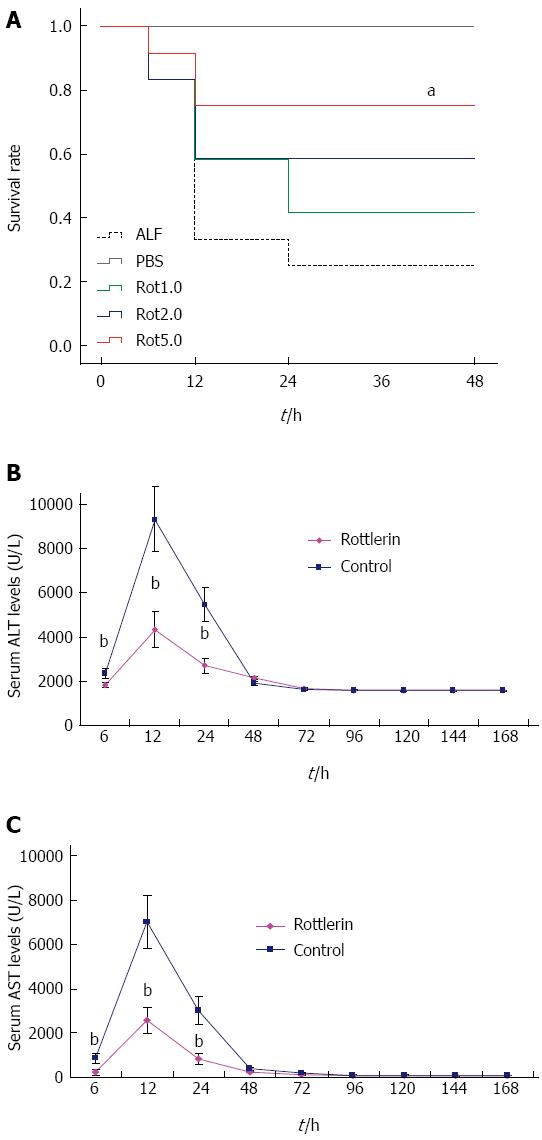
Figure 2 Inhibition of protein kinase C-δ activity with rottlerin improves survival and decreases alanine aminotransferase/aspartate aminotransferase levels in a mouse model of acute liver failure.
Animals were treated with PBS or rottlerin (0, 1, 2 and 5 μmol/L) 30 min before the induction of acute liver failure with D-galactosamine/lipopolysaccharide. A: Rottlerin increased the survival rate in a dose-dependent manner. Kaplan-Meier method was used to analyze the effect of rottlerin (5 μmol/L) on the survival rates of the animals. aP = 0.003 (log-rank test, F = 16.023); B and C: ALT /AST levels in peripheral blood samples collected at 6, 12, 24, 48, 72, 120, 144 and 168 h after treatment. Rottlerin treatment significantly decreased the levels of serum ALT at 6, 12 and 24 h (317.3 U/L ± 119.3 U/L, 2823.7 U/L ± 799.3 U/L, 1195.4 U/L ± 351.9 U/L vs 851.5 U/L ± 233.1 U/L, 7789.8 U/L ± 1473.7 U/L, 3943.8 U/L ± 760.2 U/L, t = 4.17, 10.26 and 11.37, respectively, bP < 0.01) and AST at 6, 12 and 24 h (221.1 U/L ± 124.3 U/L, 2579.1 U/L ± 596.4 U/L, 827.9 U/L ± 242.6 U/L vs 853.7 U/L ± 212.7 U/L, 7003.2 U/L ± 1179.6 U/L, 2991.2 U/L ± 629.1 U/L, t = 8.89, 11.59 and 11.11, respectively, bP < 0.01) vs the control group. The mean ± SE of three independent experiments is shown (error bar indicates SE). Rot: Rottlerin; ALT: Alanine aminotransferase, AST: Aspartate aminotransferase.
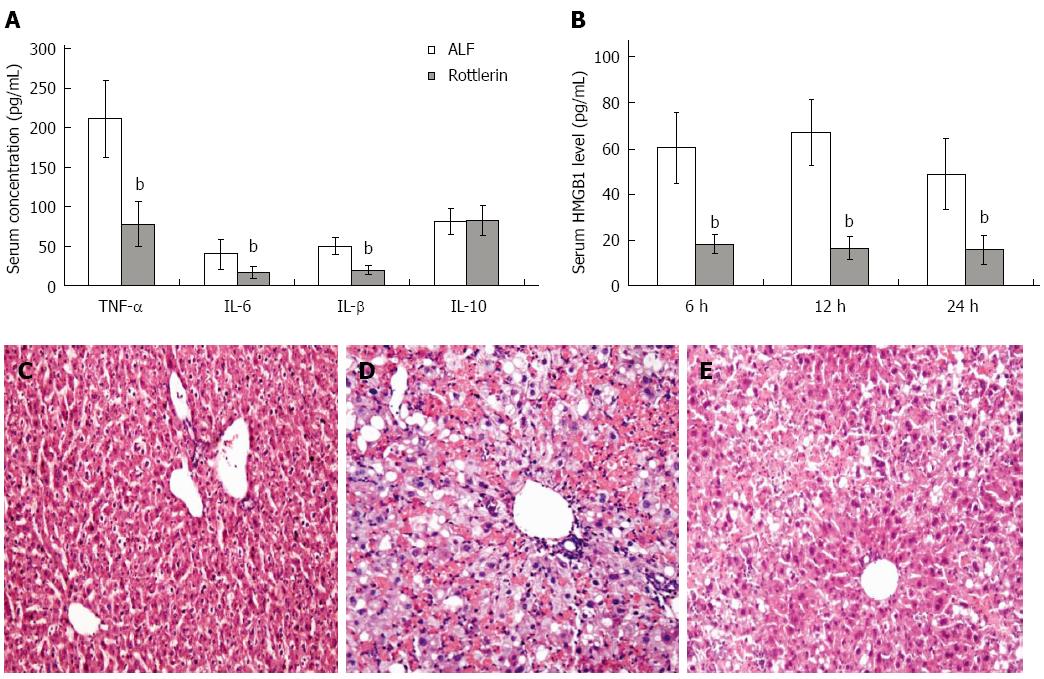
Figure 3 Inhibition of protein kinase C-δ activity with rottlerin down-regulates serum levels of inflammatory cytokines and reduces immune cell infiltration and tissue damage in mice with acute liver failure.
A: Rottlerin reduced serum levels of TNF-α, IL-1β and IL-6 significantly (77.22 pg/mL ± 28.56 pg/mL vs 211.21 pg/mL ± 49.13 pg/mL; 15.79 pg/mL ± 7.66 pg/mL vs 39.83 pg/mL ± 18.78 pg/mL; 19.25 pg/mL ± 5.23 pg/mL vs 49.44 pg/mL ± 10.77 pg/mL, t = 8.16, 4.10 and 8.73, respectively, bP < 0.01), but did not increase the anti-inflammatory cytokine IL-10 level at 12 h; B: Rottlerin reduced HMGB1 levels at 6, 12 and 24 h in mice (18.14 ng/mL ± 4.08 ng/mL vs 60.23 ng/mL ± 5.47 ng/mL; 16.21 ng/mL ± 5.11 ng/mL vs 67.14 ng/mL ± 14.27 ng/mL; 15.42 ng/mL ± 6.23 ng/mL vs 48.71 ng/mL ± 15.6 ng/mL, t = 9.13, 11.64 and 6.85, respectively, bP < 0.01); C: Normal mice; D: Acute liver failure mice; E: Rottlerin treated mice. The mean ± SE of three independent experiments is shown (error bar indicates SE). Immune-cell infiltration and tissue damage at 36 h after induction of acute liver failure were detected by H&E staining (magnification, × 100). TNF: Tumor necrosis factor; IL: Interleukin.
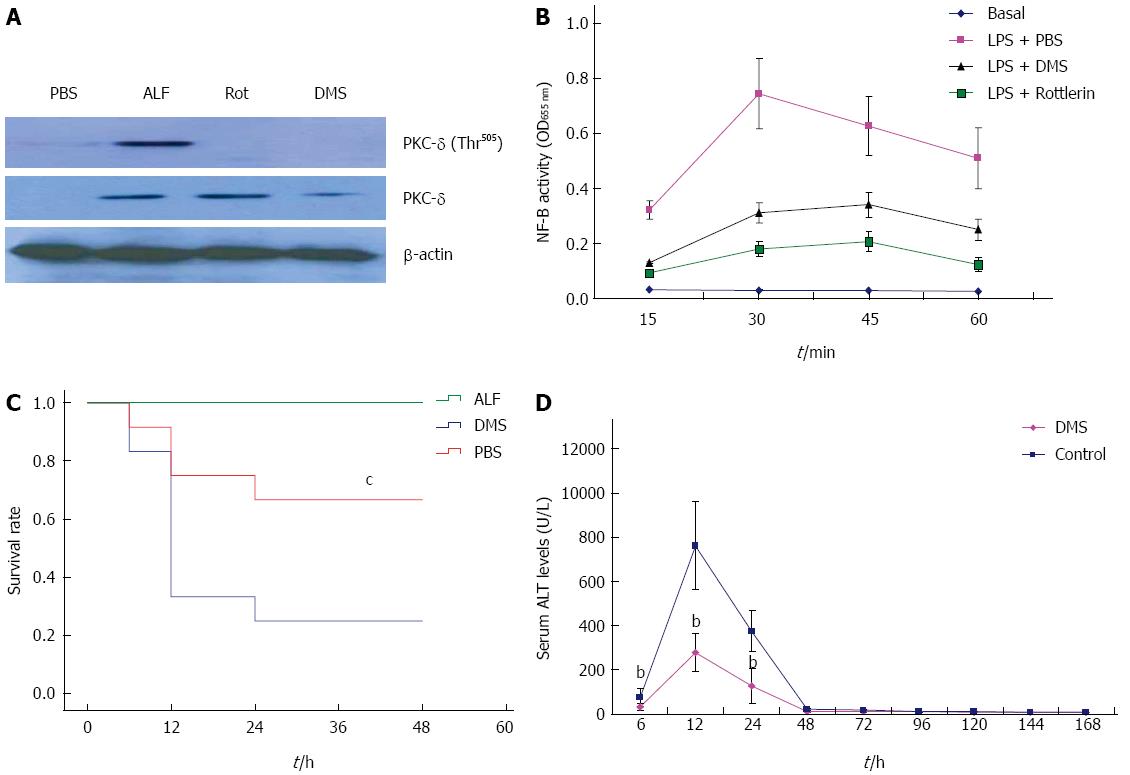
Figure 4 Sphingosine kinase 1 dependent protein kinase C-δ activation in lipopolysaccharide-stimulated macrophages and in the acute liver failure mouse model.
Animals were treated with vehicle or DMS (50 μmol/L) 30 min before the induction of acute liver failure. A: Inhibition of Sphk1 activity with DMS down-regulated PKC-δ expression and phosphorylation of Thr505 in liver tissue of mice; B: DMS and rottlerin down-regulated NF-κB activity in LPS treated macrophages; C: Kaplan-Meier analysis of the effect of DMS on the survival rate of the animals. cP = 0.001 (log-rank test, F = 14.841); D: Serum ALT levels at 6, 12, 24, 48, 72, 120, 144 and 168 h after treatment. DMS treatment decreased the levels of serum ALT at 6, 12 and 24 h (203.1 U/L ± 56.9 U/L, 2196.3 U/L ± 676.3 U/L, 982.3 U/L ± 255.9 U/L vs 453.7 U/L ± 102.3 U/L, 6993.6 U/L ± 1209.5 U/L, 2991.1 U/L ± 678.5 U/L, t = 3.79, 9.52 and 8.66, respectively, bP < 0.01). The mean ± SE of three independent experiments is shown (error bar indicates SE). DMS: N,N-dimethylsphingosine; SphK1: Sphingosine kinase 1; PKC: Protein kinase C; ALF: Acute liver failure; LPS: Lipopolysaccharide.
- Citation: Lei YC, Yang LL, Li W, Luo P. Sphingosine kinase 1 dependent protein kinase C-δ activation plays an important role in acute liver failure in mice. World J Gastroenterol 2015; 21(48): 13438-13446
- URL: https://www.wjgnet.com/1007-9327/full/v21/i48/13438.htm
- DOI: https://dx.doi.org/10.3748/wjg.v21.i48.13438


