Copyright
©The Author(s) 2015.
World J Gastroenterol. Dec 7, 2015; 21(45): 12787-12799
Published online Dec 7, 2015. doi: 10.3748/wjg.v21.i45.12787
Published online Dec 7, 2015. doi: 10.3748/wjg.v21.i45.12787
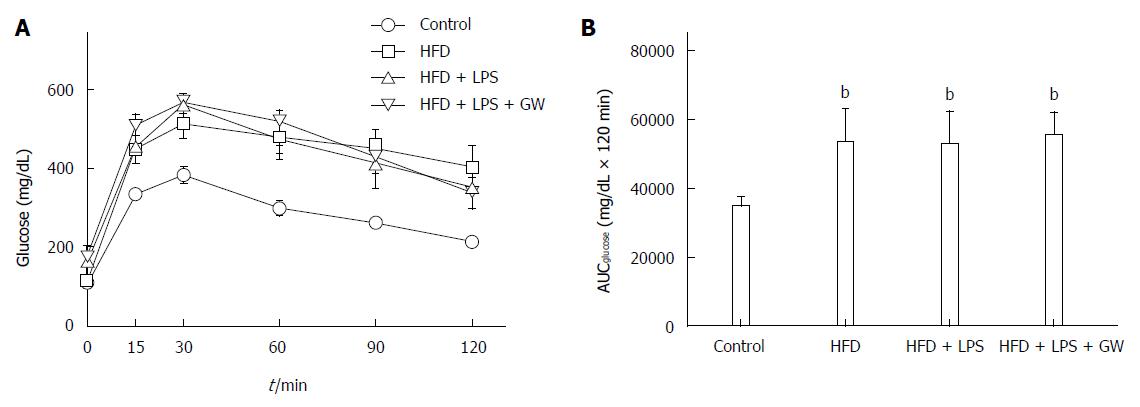
Figure 1 Effects of high-fat diet for 12 wk on glucose tolerance in male mice treated with GW501516 (GW, 3 mg/kg per day for 3 wk).
Intraperitoneal glucose tolerance test (A) and area under the curve for glucose (AUCglucose) (B) showed glucose intolerance in mice fed the HFD with or without lipopolysaccharide (LPS) injection compared with the control group. GW treatment did not improve glucose intolerance. Data are expressed as the mean ± SD (5-6 mice per group). bP < 0.01 vs control group.
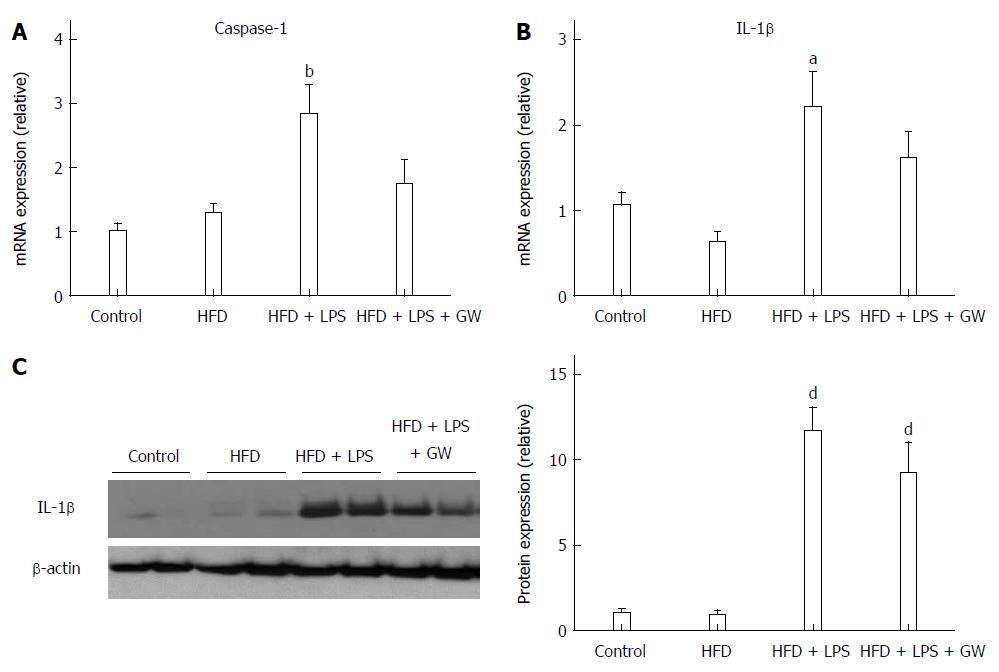
Figure 2 Effects of GW501516 on caspase-1 and IL-1β levels in mice fed a high fat diet.
Hepatic mRNA levels of caspase-1 (A) and IL-1β (B) at 12 wk showed a significant increase in the HFD + lipopolysaccharide (LPS) group compared with the control group. GW501516 treatment tended to ameliorate this increase. Representative immunoblot and graphic presentation show hepatic protein levels of IL-1β (C) in different groups of mice as indicated. Mice fed an HFD with LPS injection with or without GW501516 treatment had increased protein levels of IL-1β. Data are expressed as the mean ± SD (5-6 mice per group). aP < 0.05, bP < 0.01, and dP < 0.001 vs control group.
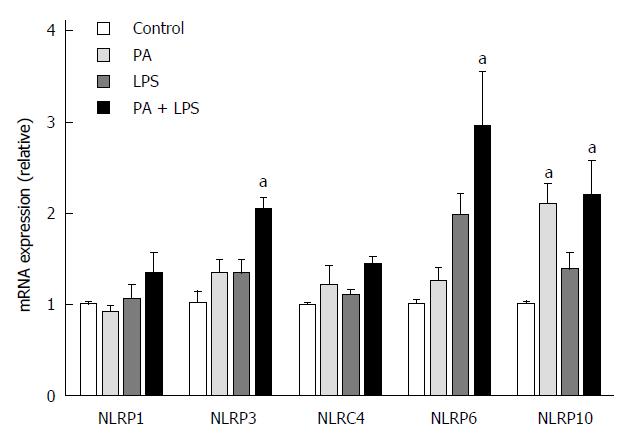
Figure 3 Expression of inflammasome components in HepG2 cells after stimulation with palmitic acid and lipopolysaccharide.
Relative mRNA levels of NLRP1, NLRP3, NLRC4, NLRP6, and NLRP10 in HepG2 cells were analyzed by RT-PCR. Compared with the control group, significantly increased expression of NLPR3, NLRP6, and NLRP10 was observed in the PA and LPS stimulation group. Data are expressed as the mean ± SD. aP < 0.05 vs control cells.
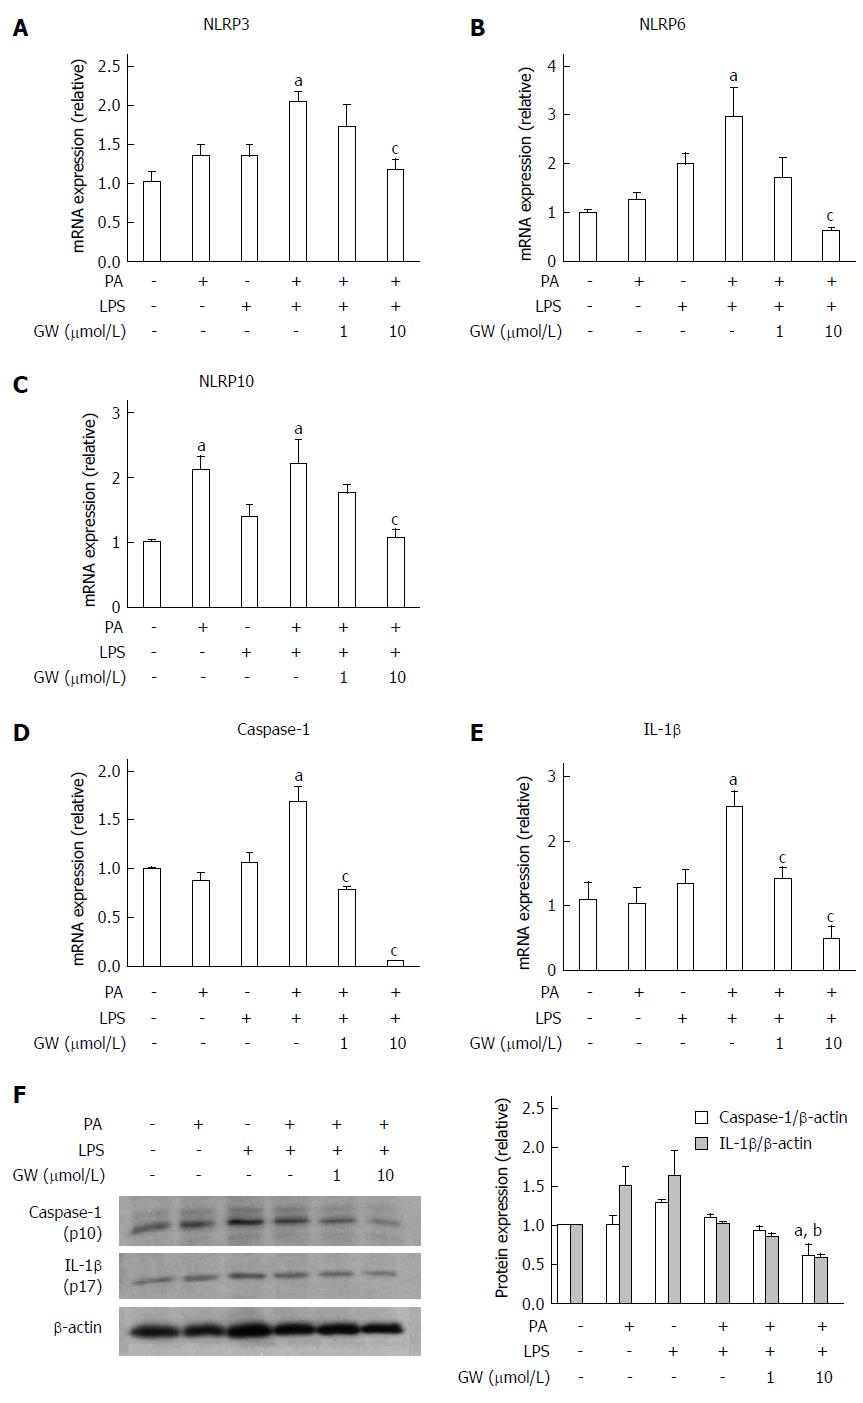
Figure 4 Effects of GW501516 on palmitic acid- and lipopolysaccharide-induced inflammasome and pro-inflammatory cytokine in HepG2 cells.
Relative mRNA levels of NLRP3 (A), NLRP6 (B), NLRP10 (C), caspase-1 (D), and IL-1β (E) in HepG2 cells were analyzed by RT-PCR. GW501516 inhibited PA- and LPS-induced mRNA expression of several inflammasome components, caspase-1, and IL-1β. Representative immunoblot and graphic presentation show protein levels of caspase-1 and IL-1β (F) in HepG2 cells. PA and LPS tended to elicit caspase-1 and IL-1β release, and GW501516 reduced this processing significantly. Data are expressed as the mean ± SD. aP < 0.05 vs control cells, cP < 0.05 and bP < 0.01 vs PA + LPS-treated cells.
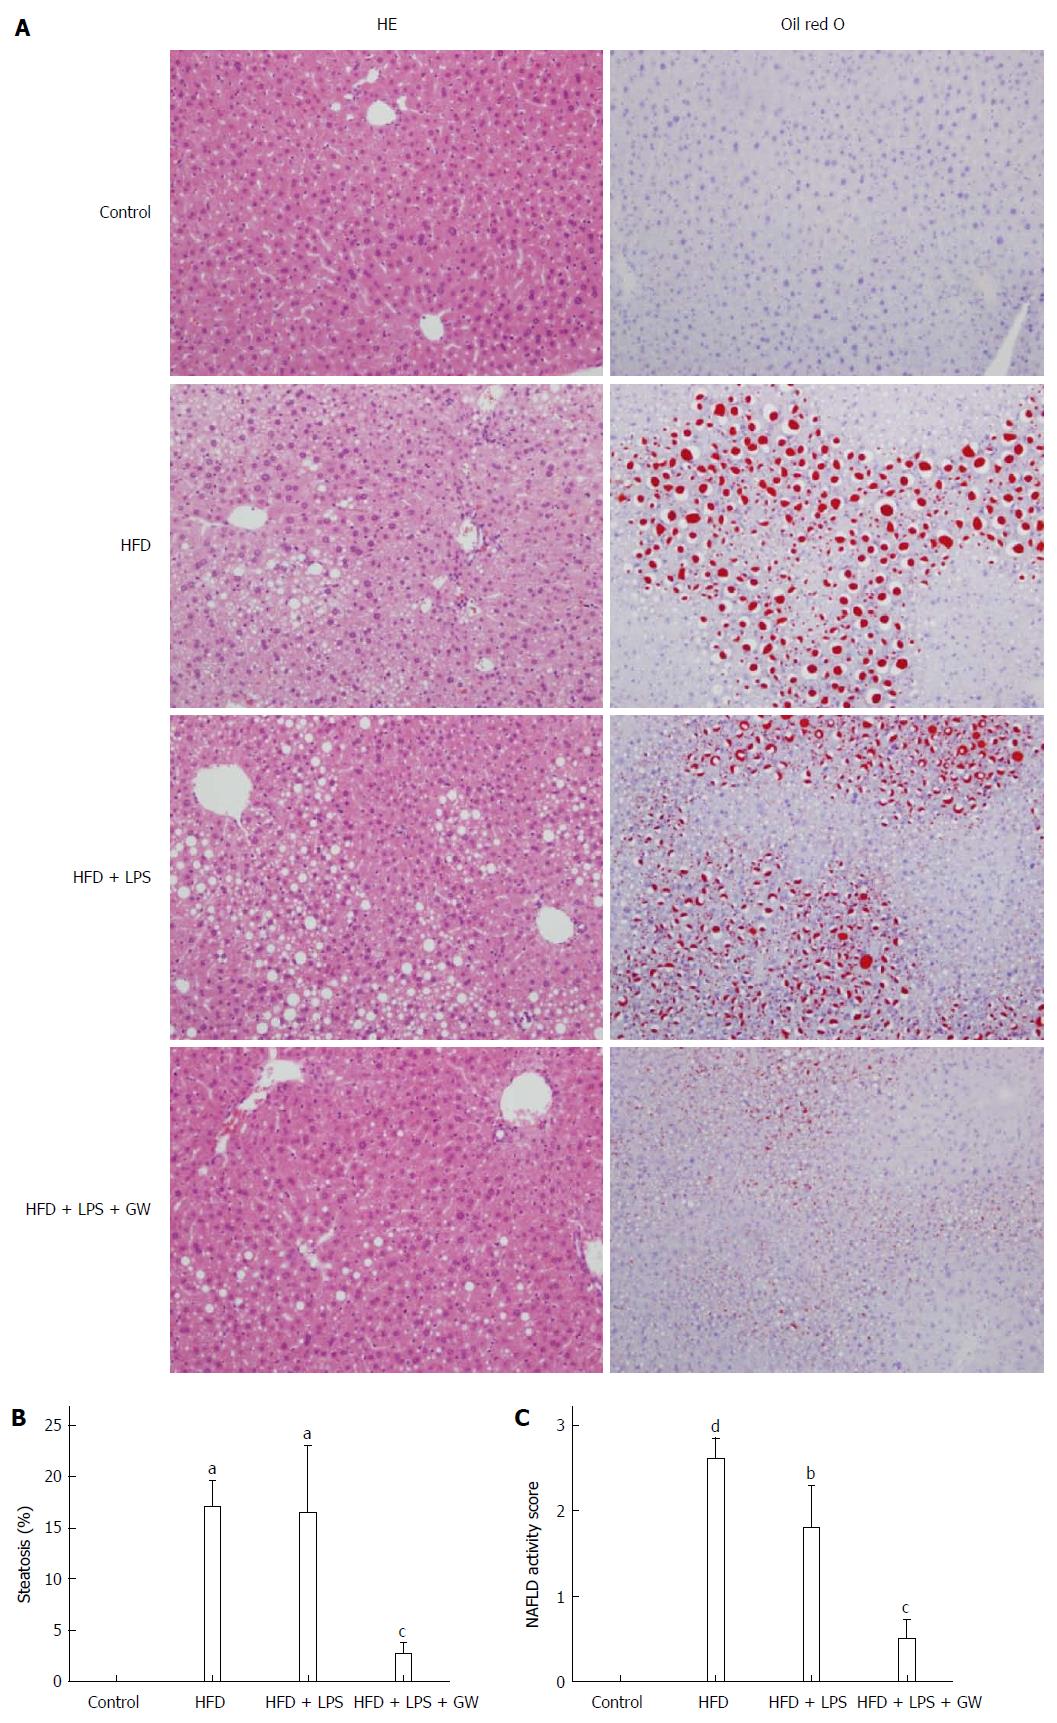
Figure 5 Histopathological features of livers in mice fed a high fat diet with or without lipopolysaccharide injection and GW501516 treatment.
A: Hematoxylin and eosin (HE) staining and Oil Red O staining of hepatic lipid accumulation (magnification × 100). In mice fed an HFD, moderate macrovesicular steatosis (17.0%) and inflammatory cell infiltration were observed compared with the control group. The macrovesicular steatosis was improved to 2.7% following GW501516 treatment; B: Histogram of the percentage of hepatocytes showing macrovesicular fatty change; C: Nonalcoholic fatty liver disease (NAFLD) activity score. The NAFLD activity score in the GW501516-treated group was significantly lower than that in the HFD + LPS group (1.8 vs 0.5, P < 0.05). Data are expressed as the mean ± standard deviation (SD) (5-6 mice per group). aP < 0.05, bP < 0.01, and dP < 0.001 vs control group. cP < 0.05 vs the HFD + LPS group.
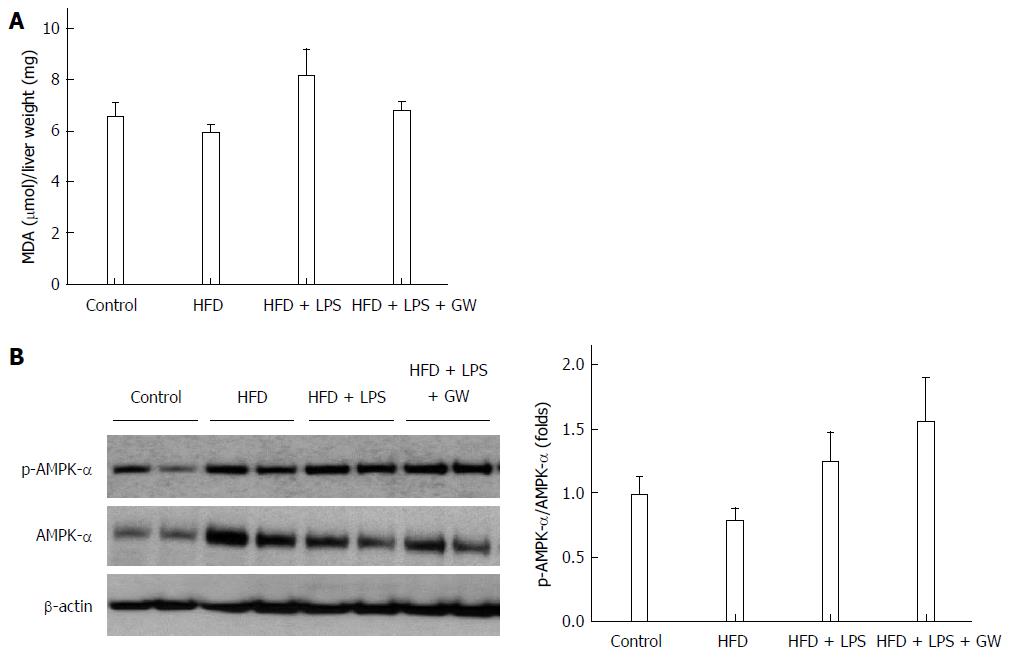
Figure 6 Effects of GW501516 on lipid peroxidation and associated molecular pattern-activated protein kinase-α phosphorylation in mice fed a high fat diet.
Liver malondialdehyde (MDA) levels (A) showed a slight increase in the HFD + lipopolysaccharide (LPS) group without statistical significance; B: Representative immunoblot and graphic presentation of p-AMPK-α and total AMPK-α protein levels in the livers of mice are shown. Treatment of GW501516 enhanced phosphorylation of AMPK-α in mice fed an HFD with LPS injection. Data are expressed as the mean ± SD (5-6 mice per group).
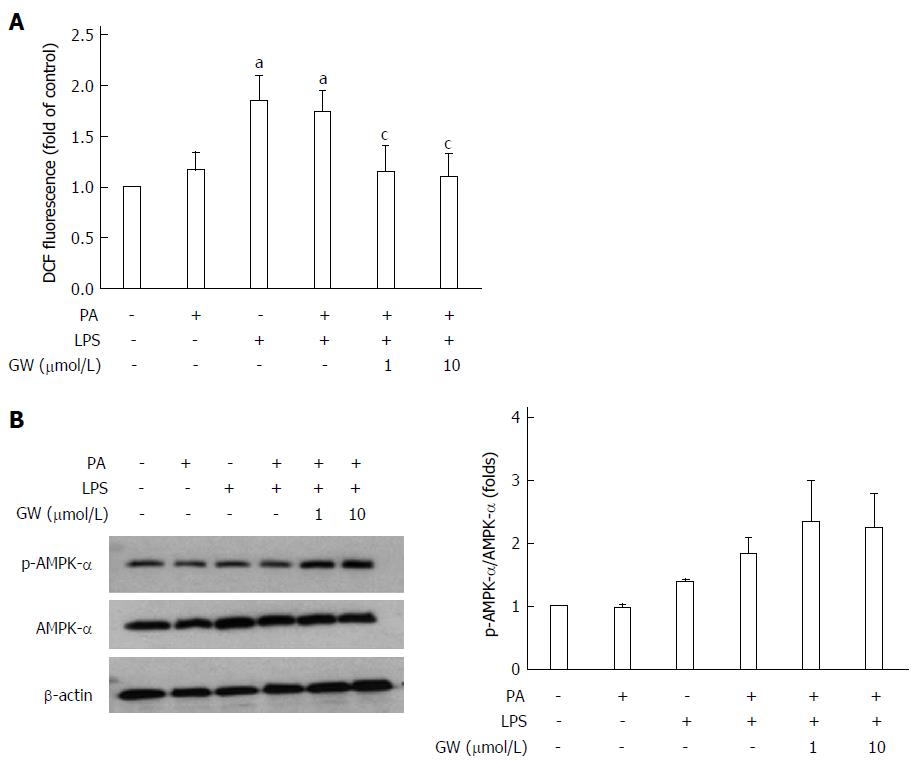
Figure 7 Effects of GW501516 on reactive oxygen species production and associated molecular pattern-activated protein kinase-α phosphorylation in HepG2 cells.
Intracellular ROS production was quantified using the fluorescent probe 2′,7′-dichlorodihydrofluorescein diacetate (DCFDA) (A). GW501516 inhibited lipopolysaccharide (LPS)- and palmitic acid (PA)-induced ROS generation. Representative immunoblot and graphic presentation of p-AMPK-α and total AMPK-α protein levels in HepG2 cells are shown (B). GW501516 tended to increase the phosphorylation of AMPK-α in PA- and LPS-treated cells. Data are expressed as the mean ± SD (5-6 mice per group). aP < 0.05 vs control cells, cP < 0.05 vs PA + LPS-treated cells.
- Citation: Lee HJ, Yeon JE, Ko EJ, Yoon EL, Suh SJ, Kang K, Kim HR, Kang SH, Yoo YJ, Je J, Lee BJ, Kim JH, Seo YS, Yim HJ, Byun KS. Peroxisome proliferator-activated receptor-delta agonist ameliorated inflammasome activation in nonalcoholic fatty liver disease. World J Gastroenterol 2015; 21(45): 12787-12799
- URL: https://www.wjgnet.com/1007-9327/full/v21/i45/12787.htm
- DOI: https://dx.doi.org/10.3748/wjg.v21.i45.12787


