Copyright
©The Author(s) 2015.
World J Gastroenterol. Dec 7, 2015; 21(45): 12778-12786
Published online Dec 7, 2015. doi: 10.3748/wjg.v21.i45.12778
Published online Dec 7, 2015. doi: 10.3748/wjg.v21.i45.12778
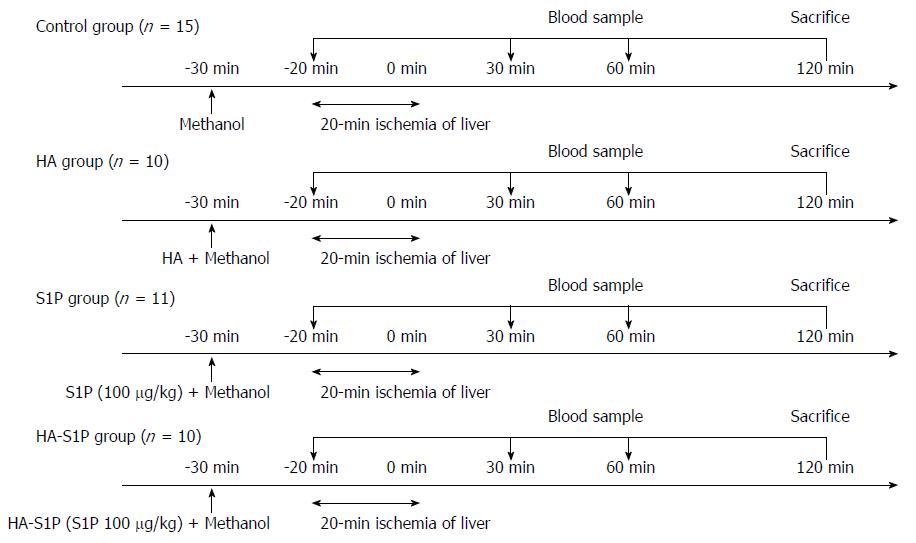
Figure 1 Experimental groups.
Total hepatic ischemia was established for 20 min by clamping the portal triad in the rat subjects. The rats were divided into 4 groups: (1) control group; (2) HA group; (3) S1P group; and (4) HA-S1P group. Each drug was injected via the tail vein 10 min before ischemia. HA: Hyaluronic acid; S1P: Sphingosine 1-phosphate.
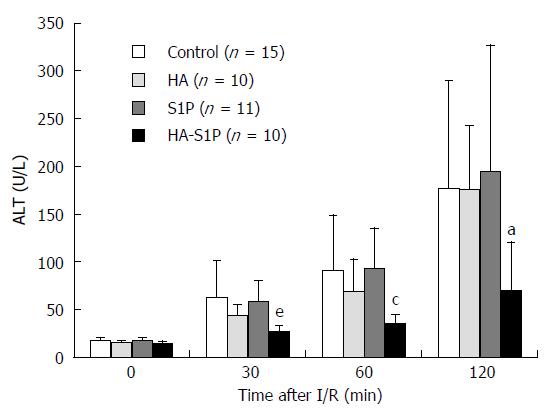
Figure 2 Serum alanine aminotransferase levels.
Serum ALT levels before ischemia and after reperfusion. Kruskal Wallis H-test. aP < 0.05 vs HA group; cP < 0.05 vs control and the HA and S1P groups; eP < 0.05 vs control and S1P groups. ALT: Alanine aminotransferase; HA: Hyaluronic acid; S1P: Sphingosine 1-phosphate; I/R: Ischemia/reperfusion.
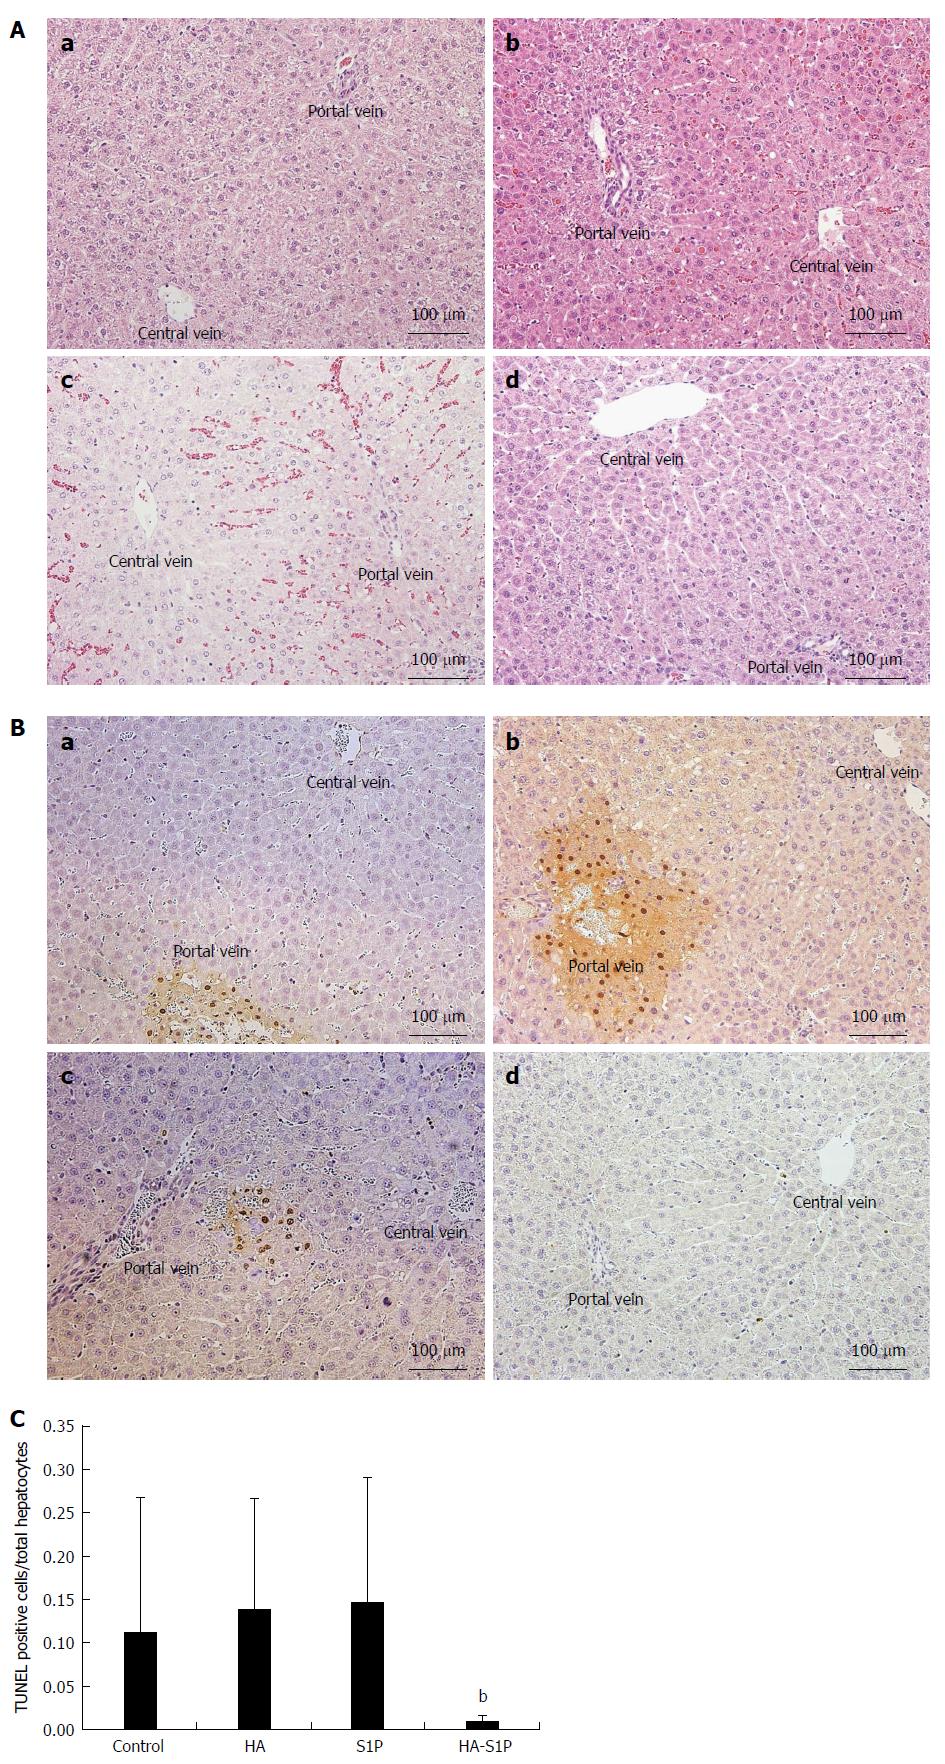
Figure 3 Histological findings.
A: HE staining In the control (a), HA (b), and S1P group (c) histologic examination revealed vacuolation of the hepatocytes and loss of palisade arrangement after 120 min of reperfusion. These findings were not observed in the HA-S1P group (d). (hematoxylin-eosin stain, magnification × 200); B: TUNEL (TdT-mediated dUTP-biotin nick end labeling) assay of the liver tissue and (C) the ratio of TUNEL-positive/total hepatocytes In the control (a), HA (b), and S1P groups (c), TUNEL-positive cells were observed in zone 1 after 120 min of reperfusion. These findings were not observed in the HA-S1P group (d). bP < 0.01 vs the control, HA, and S1P groups. HA: Hyaluronic acid; S1P: Sphingosine 1-phosphate.
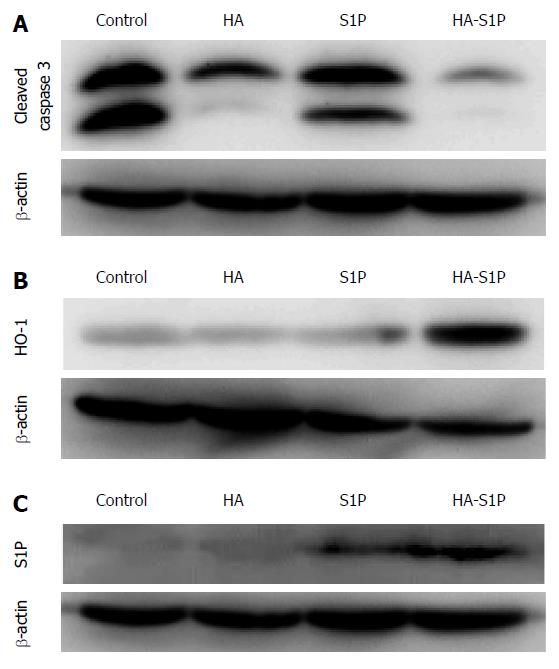
Figure 4 Western blot analysis of cleaved caspase-3 (A), heme oxygenase-1 (B) and sphingosine 1-phosphate (C) in liver tissues.
The expression of cleaved caspase-3 in the control, HA, and S1P groups, was higher than that in the HA-S1P group. The expression of HO-1 in the HA-S1P group was higher than that in the control, HA, and S1P group. The expression of S1P in the HA-S1P group was higher than in the control, HA, or S1P groups. HO-1: Heme oxygenase 1; HA: Hyaluronic acid; S1P: Sphingosine 1-phosphate.
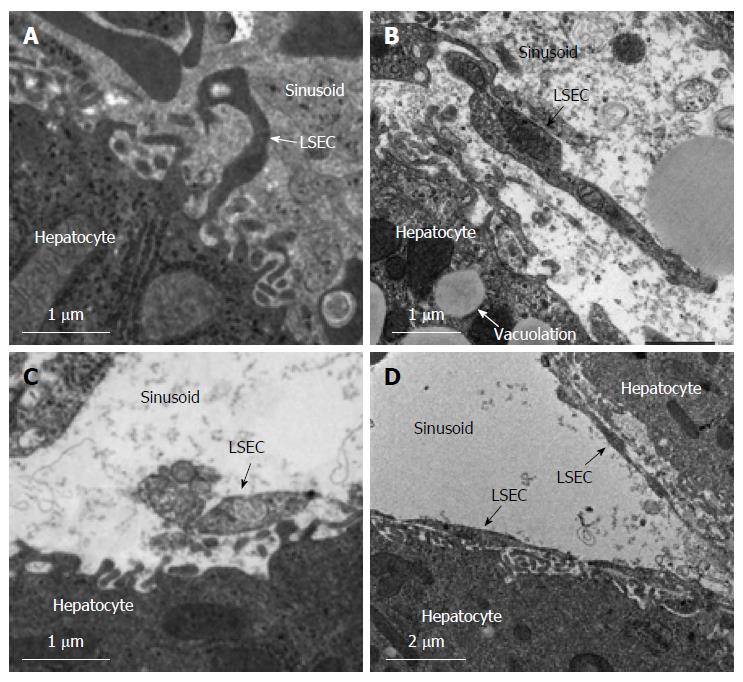
Figure 5 Transmission electron microscopic findings after 120 min of hepatic ischemia/reperfusion.
In the control (A), HA (B), and S1P groups (C), the sinusoidal endothelial linings were destroyed and detached into the sinusoidal space. In contrast, in the HA-S1P group (D), the sinusoidal endothelial cells were well preserved. HA: Hyaluronic acid; S1P: Sphingosine 1-phosphate; LSEC: Liver sinusoidal endothelial cell.
- Citation: Sano N, Tamura T, Toriyabe N, Nowatari T, Nakayama K, Tanoi T, Murata S, Sakurai Y, Hyodo M, Fukunaga K, Harashima H, Ohkohchi N. New drug delivery system for liver sinusoidal endothelial cells for ischemia-reperfusion injury. World J Gastroenterol 2015; 21(45): 12778-12786
- URL: https://www.wjgnet.com/1007-9327/full/v21/i45/12778.htm
- DOI: https://dx.doi.org/10.3748/wjg.v21.i45.12778


