Copyright
©The Author(s) 2015.
World J Gastroenterol. Nov 21, 2015; 21(43): 12498-12504
Published online Nov 21, 2015. doi: 10.3748/wjg.v21.i43.12498
Published online Nov 21, 2015. doi: 10.3748/wjg.v21.i43.12498
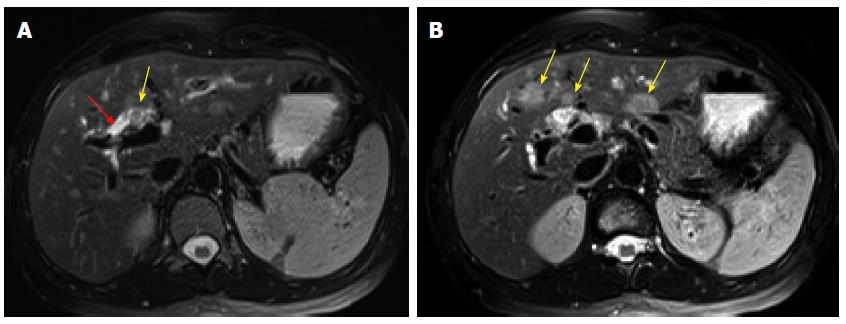
Figure 1 Non-enhanced magnetic resonance imaging.
A: Axial T2 with fat saturation (96/3000) demonstrates dilatation of the proximal right hepatic duct (red arrow) with soft tissue noted within the lumen (yellow arrow); B: Axial T2 with fat saturation (96/3000) demonstrates three ill defined, rounded hyperintense lesions in segments III and IVB (arrows).
Figure 2 Computed tomography of abdomen.
A: Axial contrast enhanced (portal phase, liver window, 200/50) demonstrates three hypodense lesions. The previously seen segment III and IVB lesions have increased in size (yellow arrows) and the one medial to the falciform ligament is now apparent (red arrow); B: Axial contrast enhanced (portal phase, liver window, 200/50) demonstrates a new liver lesion (arrow).
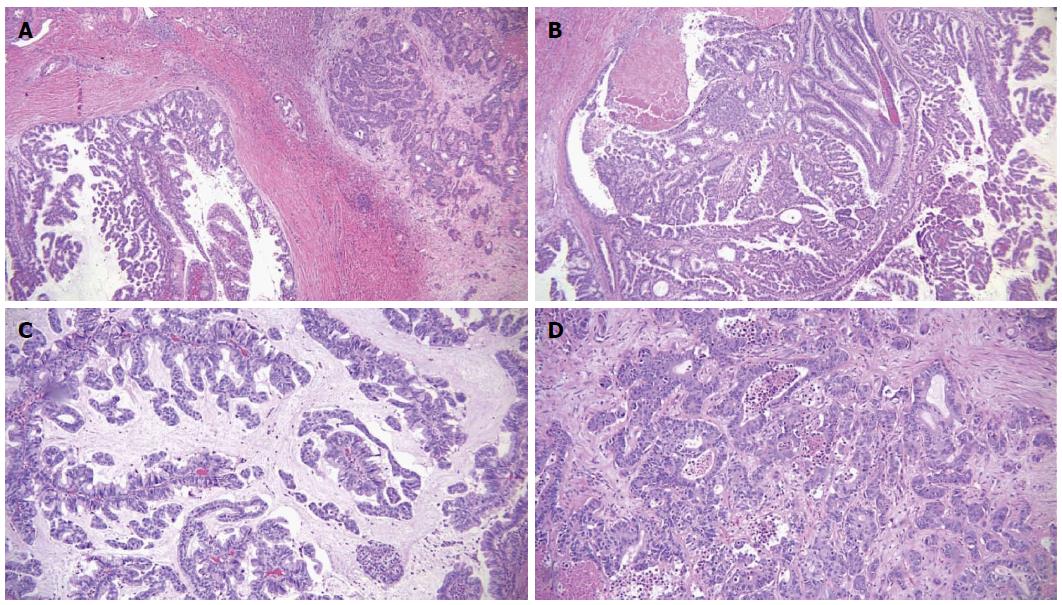
Figure 3 Microscopic features of the tumor.
A: Intraductal papillary mass with adjacent invasive adenocarcinoma; B: The papillary mass with fine vascular cores was lined by foveolar type epithelium; C: Some areas showed mucin production; D: The metastatic masses in the liver showed infiltrative features.
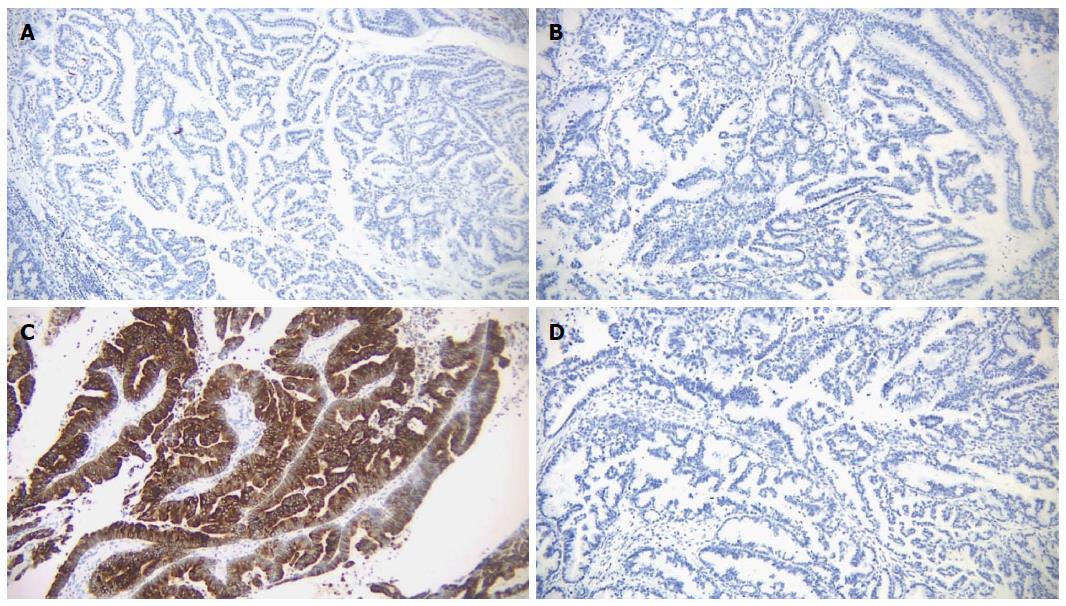
Figure 4 By immunohistochemistry, the tumor cells were negative for MUC1 (A), MUC2 (B) and CDX2 (D), and positive for MUC5 (C).
- Citation: Tan Y, Milikowski C, Toribio Y, Singer A, Rojas CP, Garcia-Buitrago MT. Intraductal papillary neoplasm of the bile ducts: A case report and literature review. World J Gastroenterol 2015; 21(43): 12498-12504
- URL: https://www.wjgnet.com/1007-9327/full/v21/i43/12498.htm
- DOI: https://dx.doi.org/10.3748/wjg.v21.i43.12498


