Copyright
©The Author(s) 2015.
World J Gastroenterol. Nov 21, 2015; 21(43): 12448-12456
Published online Nov 21, 2015. doi: 10.3748/wjg.v21.i43.12448
Published online Nov 21, 2015. doi: 10.3748/wjg.v21.i43.12448
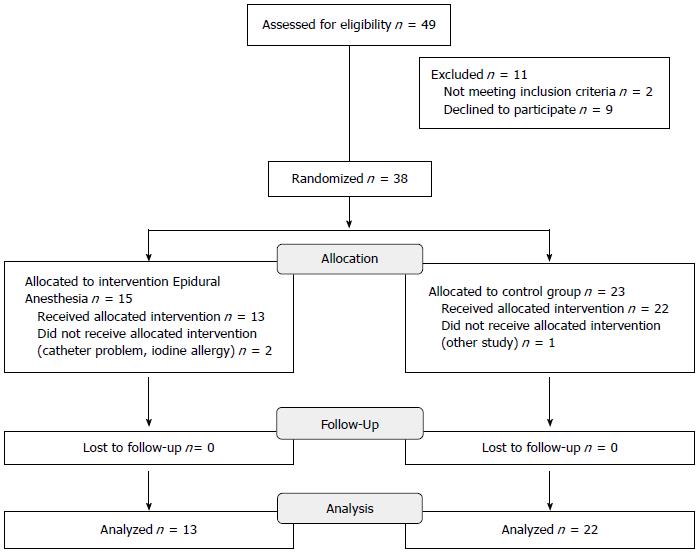
Figure 1 CONSORT diagram showing randomization and allocation of the study cohort.
Figure 2 Perfusion computed tomography color map and standard computed tomography of the pancreas obtained in a 75-year-old woman admitted for acute severe pancreatitis, randomized to group 1 (epidural anesthesia).
A: Axial image obtained at admission shows a positive enhancement integral (PEI) value of 15.9 in the pancreatic body; B: Axial image obtained with control computed tomography (CT), 72 h after admission, shows a 29% improvement of the perfusion in the pancreatic body (PEI of 20.5) when compared to admission values; C: Standard CT axial oblique image at the level of the pancreas obtained on admission, during portal phase.
Figure 3 Perfusion computed tomography color map and standard computed tomography of the pancreas obtained in a 73-year-old man admitted for acute severe pancreatitis, randomized to group 2 (control group).
A: Axial image obtained on admission shows a positive enhancement integral (PEI) value of 16.5 in the pancreatic head; B: Axial image obtained with control computed tomography (CT), 72 h after admission, shows a 53% impairment of the perfusion in the pancreatic head (PEI of 7.8) when compared to admission values; C: Standard CT axial oblique image, at the level of the pancreas obtained on admission, during portal phase.
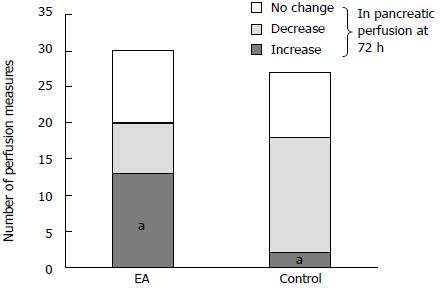
Figure 4 Changes in pancreatic perfusion measurements at 72 h compared to the measurements.
On admission in the epidural anesthesia (EA) and control group (significant increase, decrease or no change in perfusion). aP = 0.0025 vs control.
- Citation: Sadowski SM, Andres A, Morel P, Schiffer E, Frossard JL, Platon A, Poletti PA, Bühler L. Epidural anesthesia improves pancreatic perfusion and decreases the severity of acute pancreatitis. World J Gastroenterol 2015; 21(43): 12448-12456
- URL: https://www.wjgnet.com/1007-9327/full/v21/i43/12448.htm
- DOI: https://dx.doi.org/10.3748/wjg.v21.i43.12448


