Copyright
©The Author(s) 2015.
World J Gastroenterol. Nov 21, 2015; 21(43): 12421-12429
Published online Nov 21, 2015. doi: 10.3748/wjg.v21.i43.12421
Published online Nov 21, 2015. doi: 10.3748/wjg.v21.i43.12421
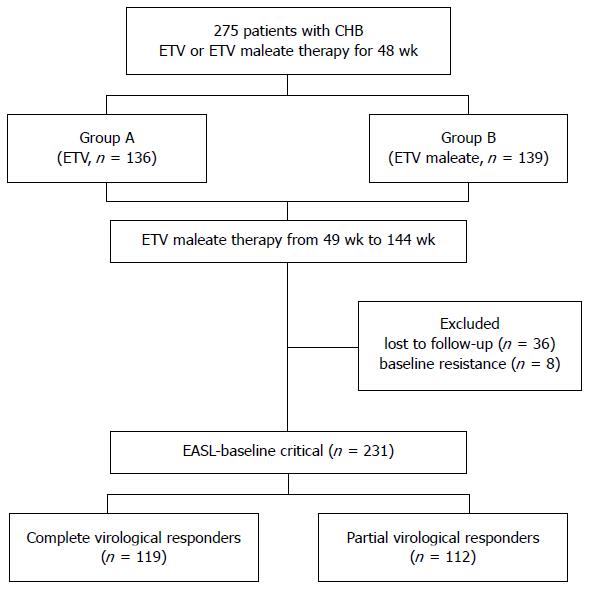
Figure 1 Flow chart illustrating patient selection and categorization based on EASL.
CHB: Chronic hepatitis B; ETV: Entecavir; CVR: Complete virological response; EASL-baseline critical: HBV DNA levels at week 48 in patients treated by entecavir.
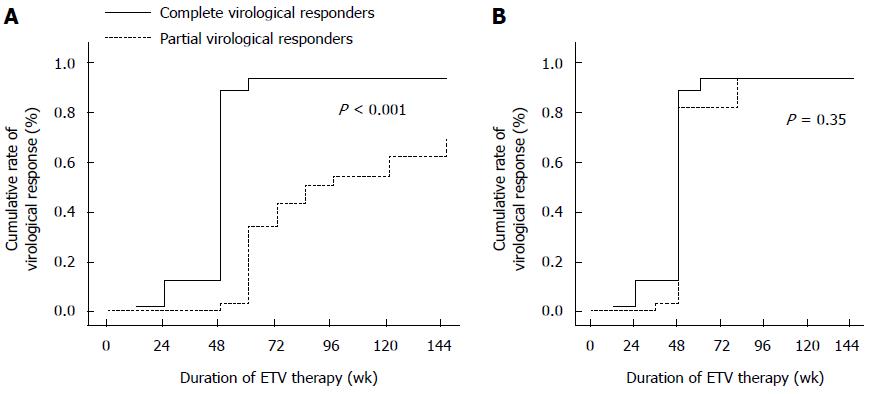
Figure 2 Kaplan-Meier analysis of the cumulative rate of virological response for hepatitis B e antigen-positive (A) or -negative (B) patients between complete virological response and partial virological response groups.
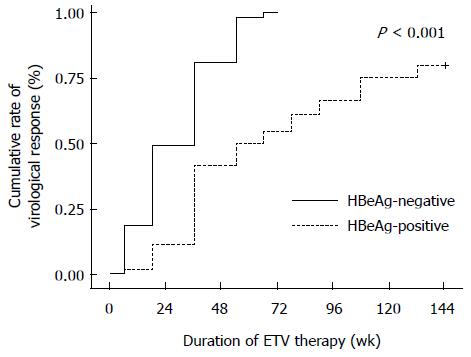
Figure 3 Kaplan-Meier curve for the probability of achieving virological response according to hepatitis B e antigen status at baseline.
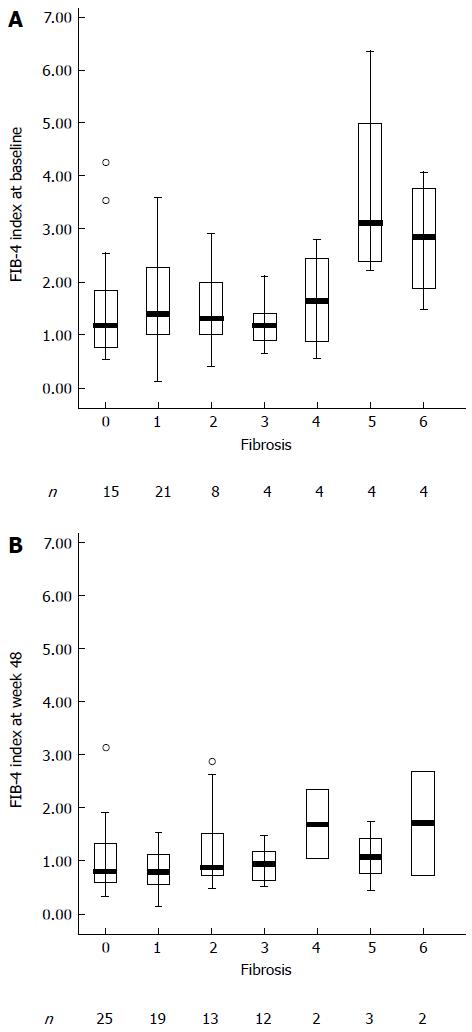
Figure 4 Box plots of FIB-4 index according to Ishak score at baseline (A) or at week 48 (B).
The FIB-4 index did not show a significant difference among Ishak scores 0-3 (P = 0.76). There was also no significant difference among Ishak scores 4-6 (P = 0.17). The FIB-4 index show a significant difference between Ishak scores 0-3 and Ishak scores 4-6 (P < 0.001). The value of FIB-4 index decreased dramatically from baseline to week 48.
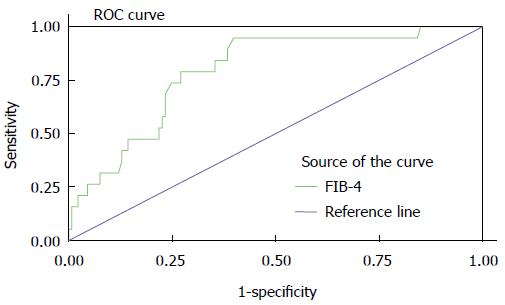
Figure 5 Receiver operating characteristic curve for FIB-4 index in identifying fibrosis (Ishak score) in the total cohort (n = 152).
FIB-4 had an area under the receiver operating characteristic curve of 0.80. ROC: Receiver operating characteristic.
- Citation: Li N, Xu JH, Yu M, Wang S, Si CW, Yu YY. Relationship between virological response and FIB-4 index in chronic hepatitis B patients with entecavir therapy. World J Gastroenterol 2015; 21(43): 12421-12429
- URL: https://www.wjgnet.com/1007-9327/full/v21/i43/12421.htm
- DOI: https://dx.doi.org/10.3748/wjg.v21.i43.12421


