Copyright
©The Author(s) 2015.
World J Gastroenterol. Nov 21, 2015; 21(43): 12381-12391
Published online Nov 21, 2015. doi: 10.3748/wjg.v21.i43.12381
Published online Nov 21, 2015. doi: 10.3748/wjg.v21.i43.12381
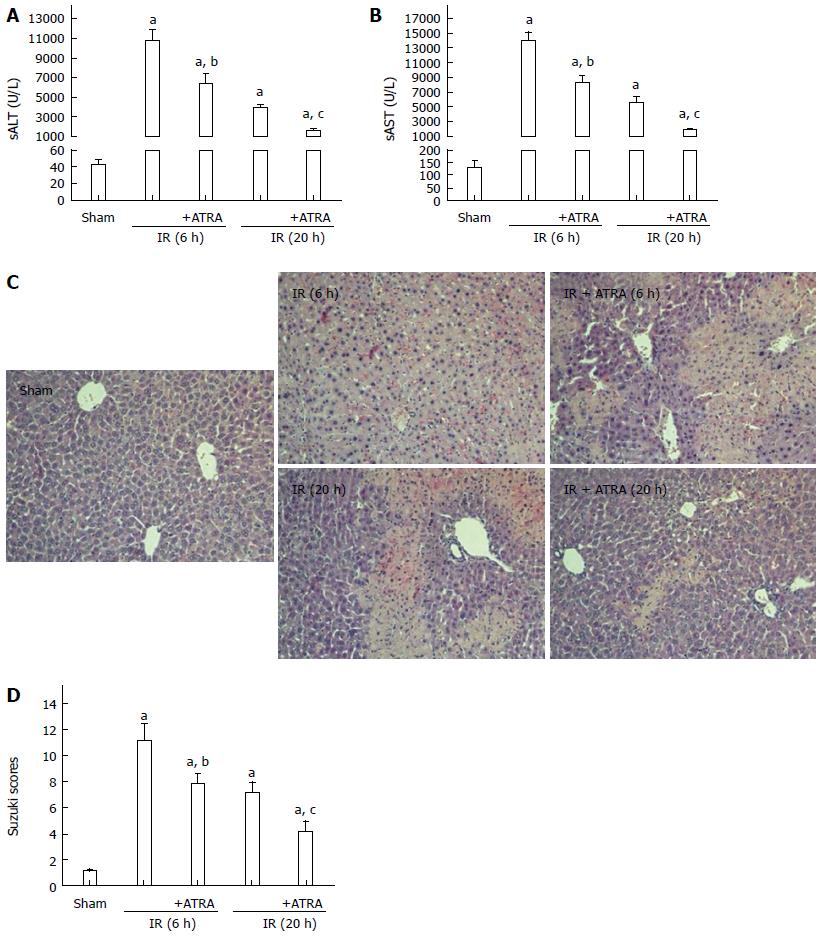
Figure 1 All-trans retinoic acid pretreatment ameliorates liver ischemia and reperfusion injury.
Hepatic ischemia was induced in mice for 90 min, and then the mice were sacrificed at 6 h or 20 h after reperfusion. A, B: Hepatocellular function as assessed by sALT and sAST levels; C: Liver samples were stained with hematoxylin and eosin (magnification × 200); D: Liver histological grade by the Suzuki criteria. Mean ± SD, n = 3-5/group, aP < 0.05 vs the sham group; bP < 0.05 vs the IR 6 h group; cP < 0.05 vs the IR 20 h group. ATRA: All-trans retinoic acid; IR: Ischemia and reperfusion; sALT: Serum alanine aminotransferase; sAST: Serum aspartate aminotransferase.
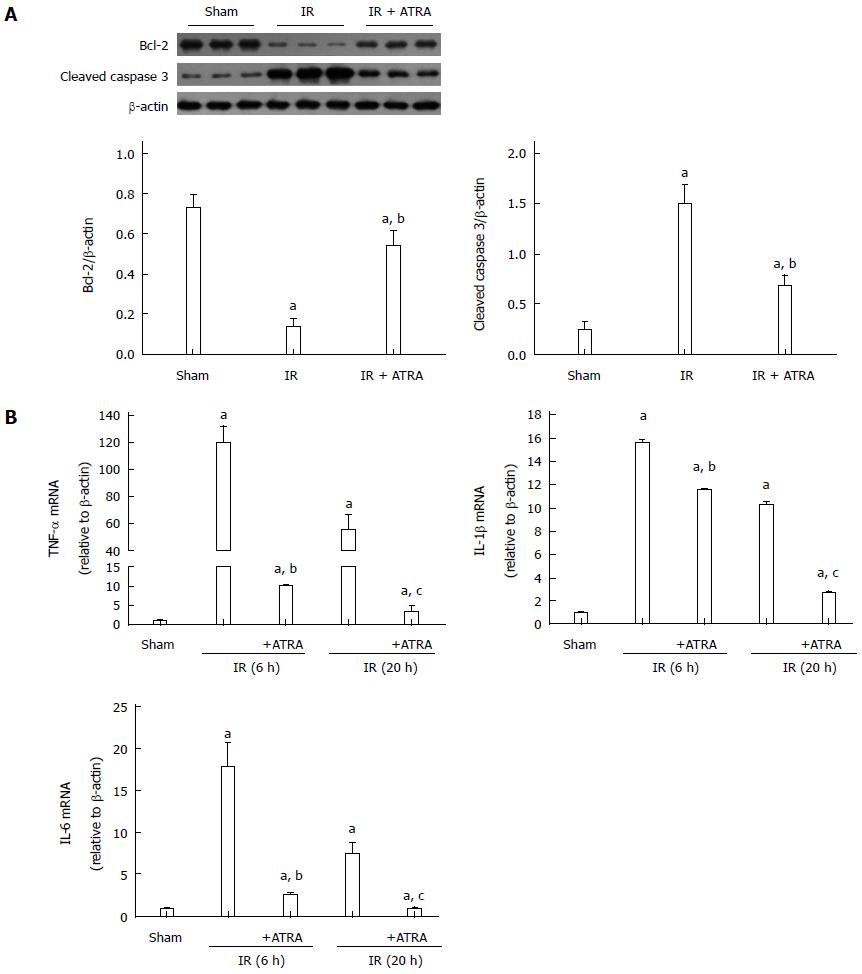
Figure 2 All-trans retinoic acid pretreatment reduces apoptosis and inflammation in liver ischemia and reperfusion injury.
A: Apoptosis-related proteins Bcl-2 and cleaved caspase 3 expression was detected by Western blot to demonstrate relative quantities in liver tissues; B: The levels of TNF-α, IL-1β and IL-6 mRNAs were analyzed. Mean ± SD, n = 3-5/group, aP < 0.05 vs the sham group; bP < 0.05 vs the IR 6h group; cP < 0.05 vs the IR 20h group. TNF: Tumor necrosis factor; IL: Interleukin; IR: Ischemia and reperfusion; ATRA: All-trans retinoic acid.
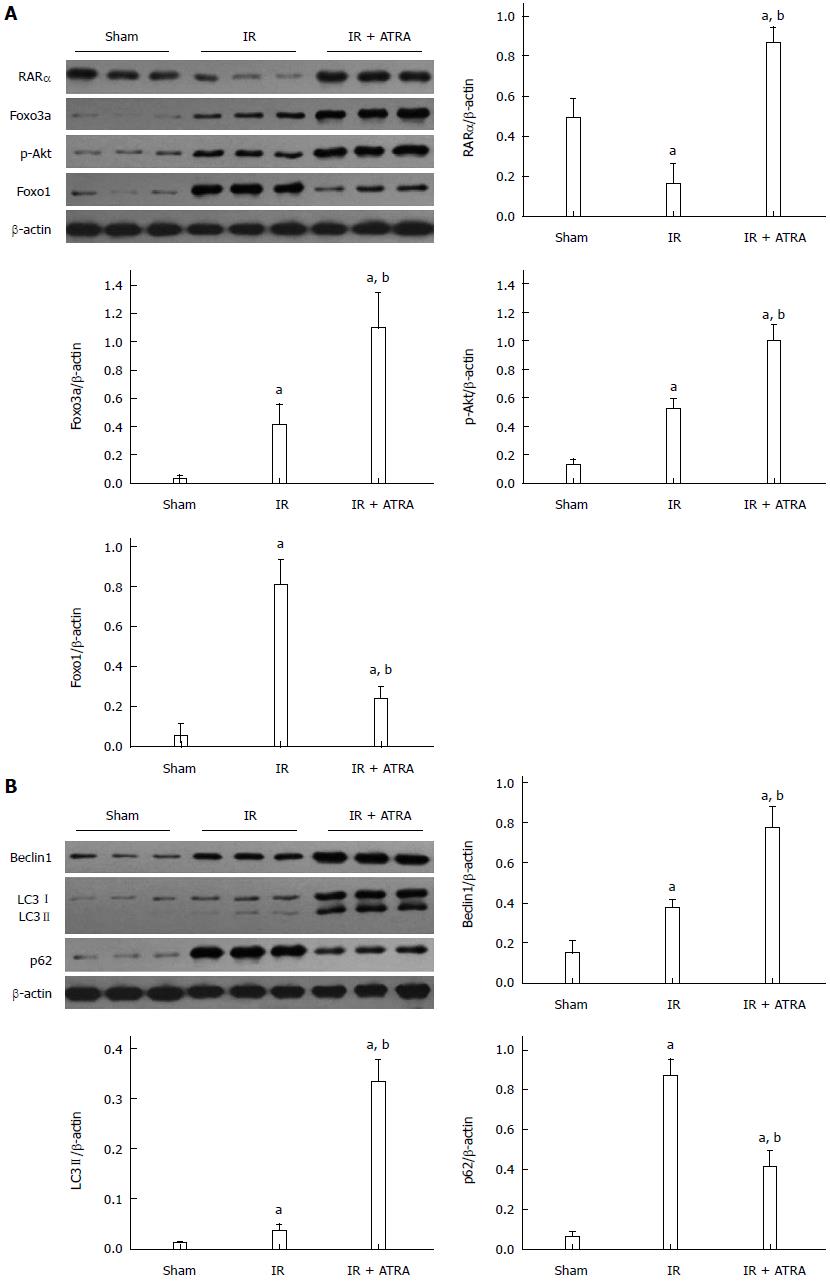
Figure 3 Autophagy is promoted by all-trans retinoic acid.
A: Western blot assessment of RARα, Foxo3a, p-Akt, Foxo1, and β-actin expression levels; B: Western blot analysis of Beclin1, LC3I/II, p62 and β-actin expression levels. Mean ± SD, n = 3-5/group, aP < 0.05 vs the sham group; bP < 0.05 vs the IR 6 h group. IR: Ischemia and reperfusion; ATRA: All-trans retinoic acid.
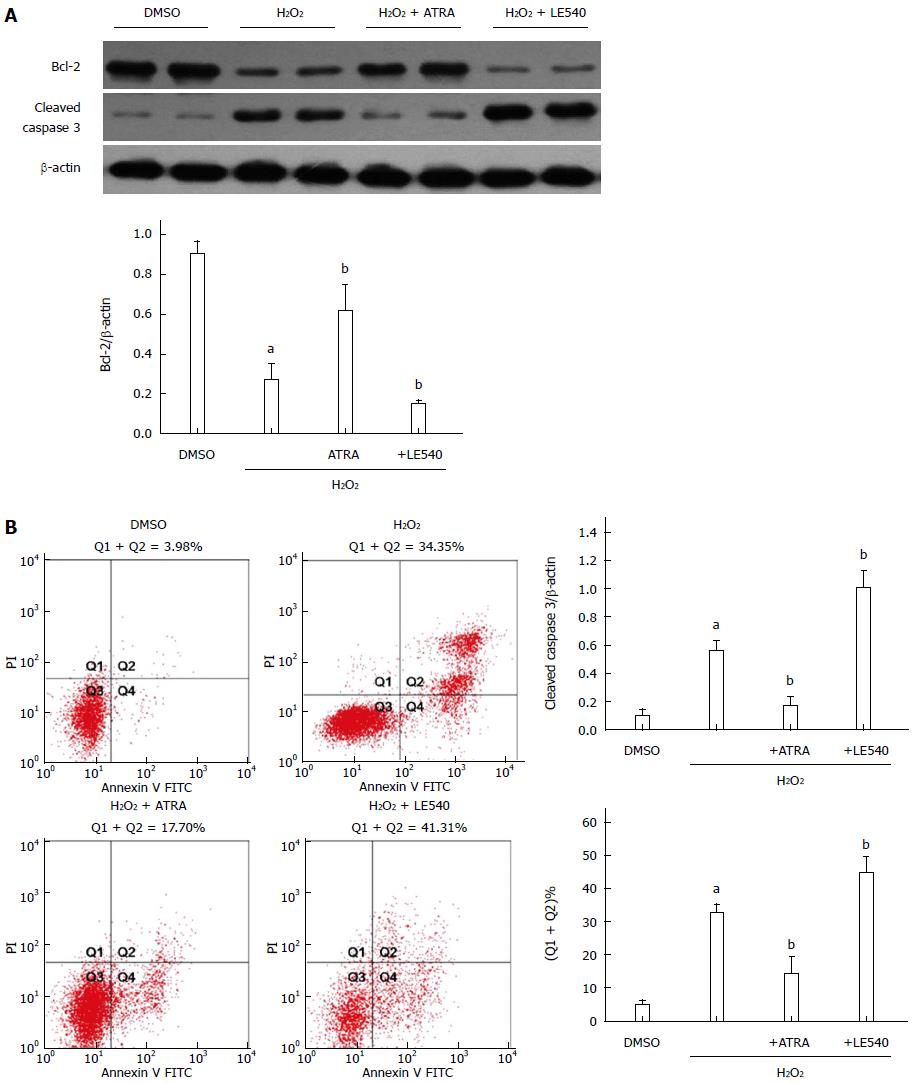
Figure 4 Retinoic acid receptor α inhibits reactive oxygen species-induced apoptosis in vitro.
LE540, an inhibitor of RARα, was cocultured with FL83B cells for 24 h, and then the cells were harvested 6 h after H2O2 treatment. A: Expression levels of Bcl-2, cleaved caspase 3 and β-actin were measured by Western blot; B: The number of apoptotic cells was assessed by AV and PI labeling. Mean ± SD, n = 3-5/group, aP < 0.05 vs the DMSO group; bP < 0.05 vs the H2O2 group. RARα: Retinoic acid receptor α; AV: Annexin V; PI: Propidium iodide; FITC: Fluorescein isothiocyanate; ATRA: All-trans retinoic acid.
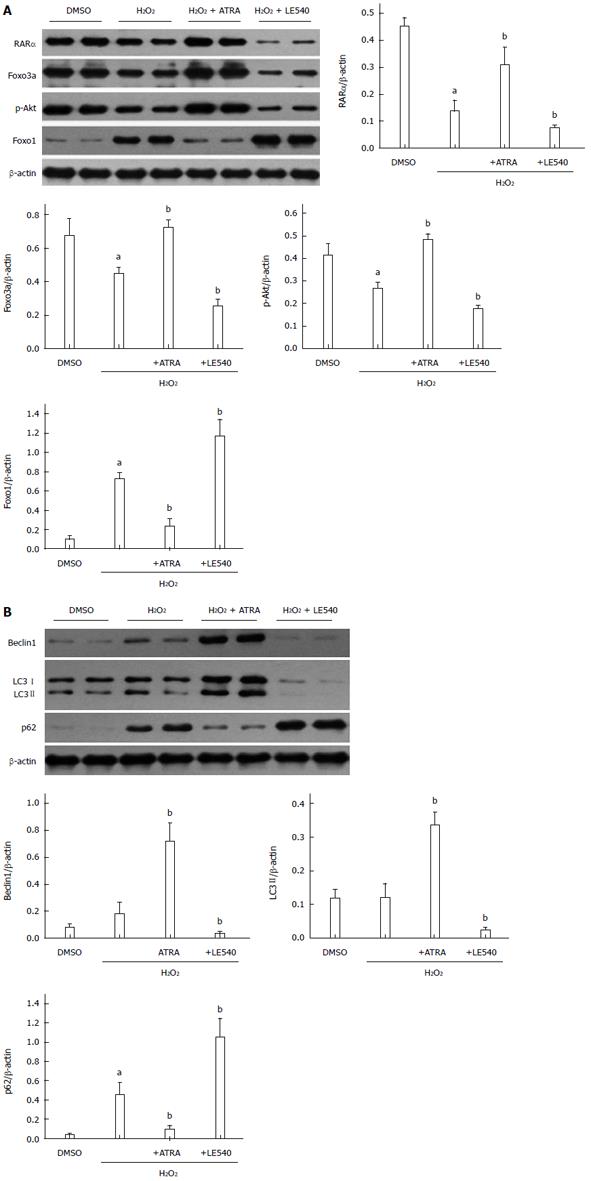
Figure 5 Retinoic acid receptor α mediates autophagy through the Foxo3a/p-Akt/Foxo1 pathway.
A: Western blot assessment of RARα, Foxo3a, p-Akt, Foxo1, and β-actin expression levels. B: Western blot analysis of Beclin1, LC3I/II, p62 and β-actin expression levels. Mean ± SD, n = 3-5/group, aP < 0.05 vs the DMSO group; bP < 0.05 vs the H2O2 group. RARα: Retinoic acid receptor α; ATRA: All-trans retinoic acid.
- Citation: Zhong C, Pu LY, Fang MM, Gu Z, Rao JH, Wang XH. Retinoic acid receptor α promotes autophagy to alleviate liver ischemia and reperfusion injury. World J Gastroenterol 2015; 21(43): 12381-12391
- URL: https://www.wjgnet.com/1007-9327/full/v21/i43/12381.htm
- DOI: https://dx.doi.org/10.3748/wjg.v21.i43.12381


