Copyright
©The Author(s) 2015.
World J Gastroenterol. Nov 21, 2015; 21(43): 12370-12380
Published online Nov 21, 2015. doi: 10.3748/wjg.v21.i43.12370
Published online Nov 21, 2015. doi: 10.3748/wjg.v21.i43.12370
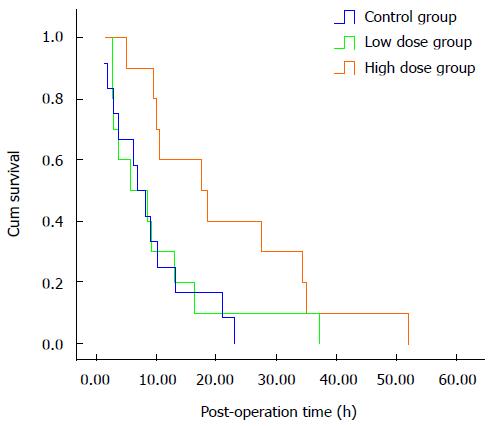
Figure 1 Kaplan-Meier survival curves of the three experimental animal groups.
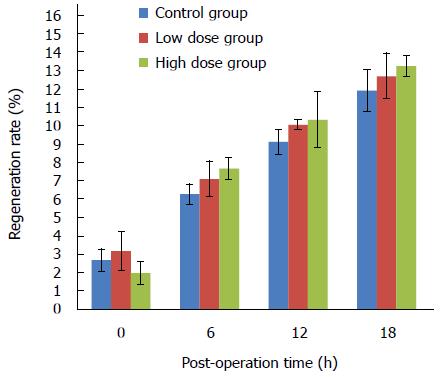
Figure 2 Regeneration rates at various time points in three groups.
Figure 3 Hematoxylin-eosin staining in the high-dose group at 0 h (A), 6 h (B), 12 h (C) and 18 h (D) (magnification × 100).
Figure 4 BrdU positive rates of the caudate lobe hepatocytes at various time points in three groups.
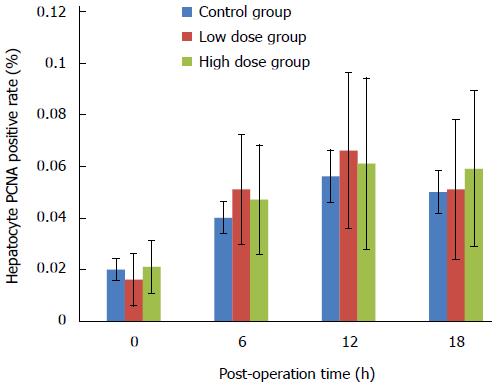
Figure 5 Proliferating cell nuclear antigen positive rates of the caudate lobe hepatocytes at various time points in three groups.
PCNA: Proliferating cell nuclear antigen.
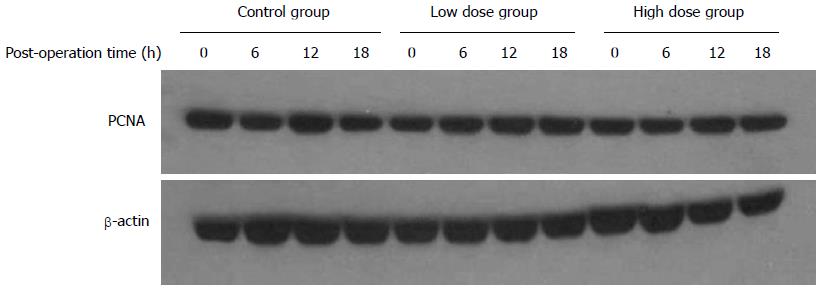
Figure 6 Expression of proliferating cell nuclear antigen in the caudate lobe detected by Western blot at various time points in three groups.
PCNA: Proliferating cell nuclear antigen.
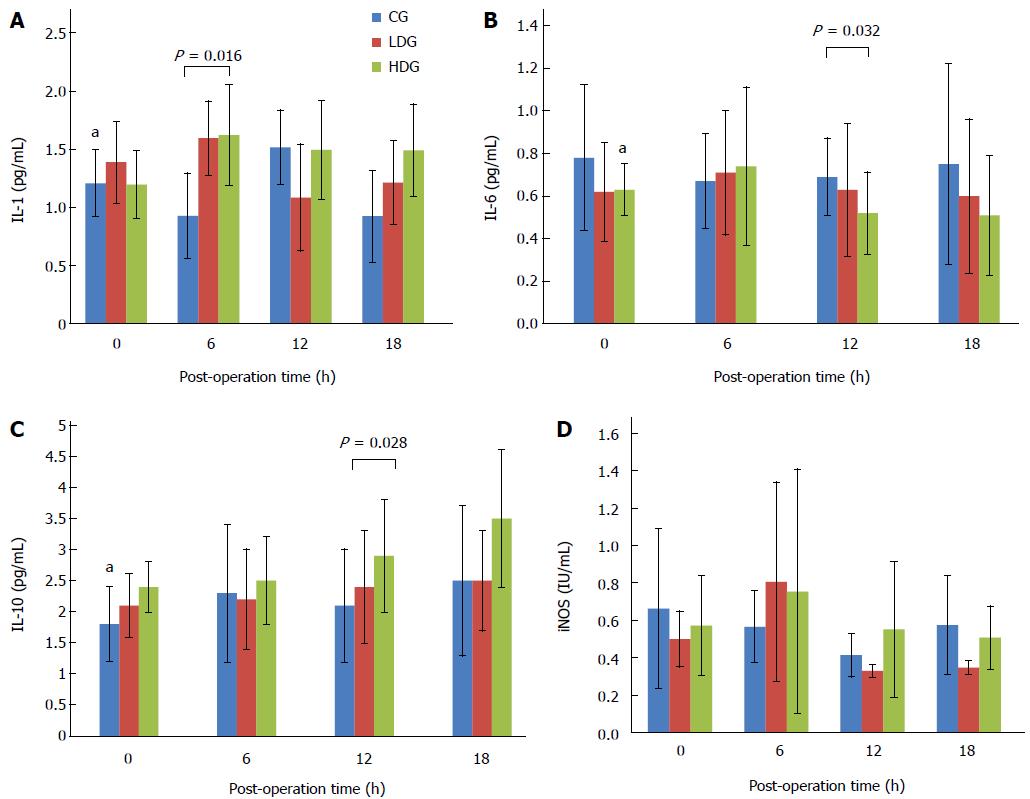
Figure 7 Expression of cytokines IL-1, IL-6, IL-10 and iNOS at various time points in three groups.
aP < 0.05.
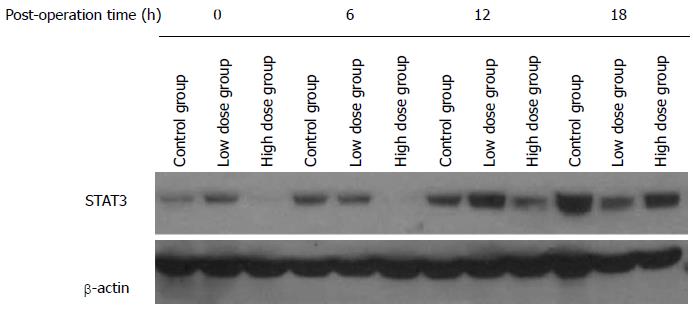
Figure 8 Expression of STAT3 in caudate lobe detected by Western blot at various time points in three groups.
- Citation: Tang GH, Yang HY, Zhang JC, Ren JJ, Sang XT, Lu X, Zhong SX, Mao YL. Magnesium isoglycyrrhizinate inhibits inflammatory response through STAT3 pathway to protect remnant liver function. World J Gastroenterol 2015; 21(43): 12370-12380
- URL: https://www.wjgnet.com/1007-9327/full/v21/i43/12370.htm
- DOI: https://dx.doi.org/10.3748/wjg.v21.i43.12370


