Copyright
©The Author(s) 2015.
World J Gastroenterol. Nov 14, 2015; 21(42): 12197-12210
Published online Nov 14, 2015. doi: 10.3748/wjg.v21.i42.12197
Published online Nov 14, 2015. doi: 10.3748/wjg.v21.i42.12197
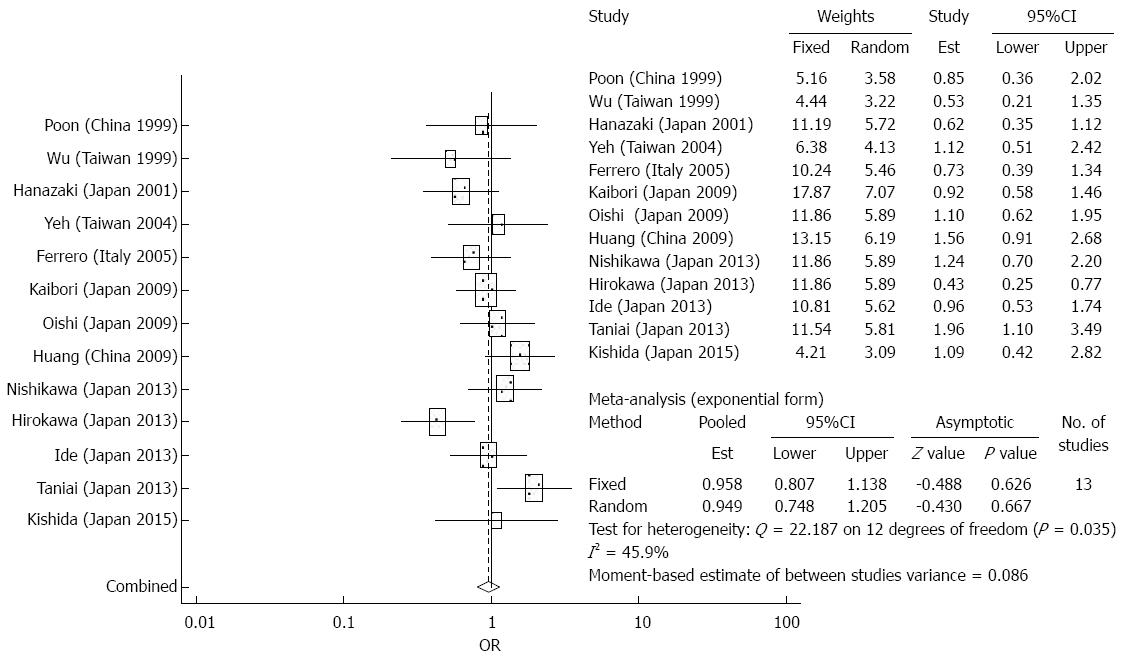
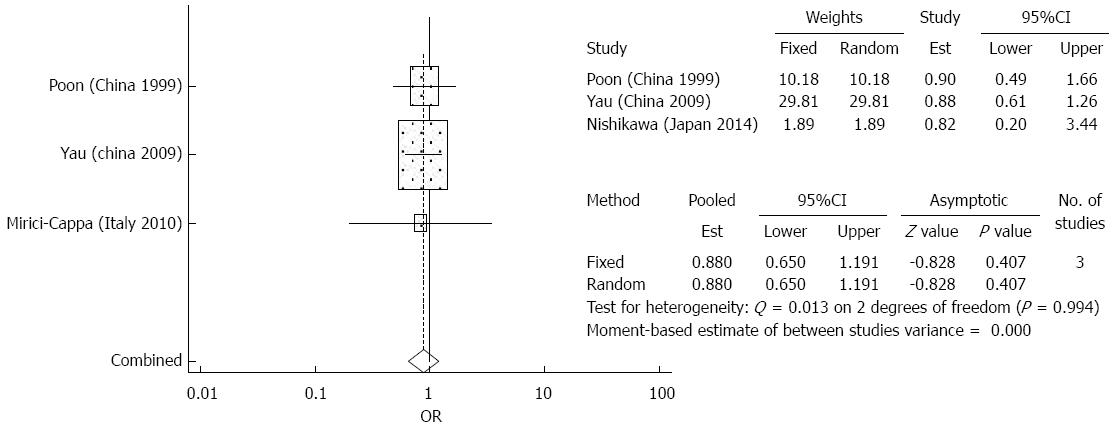
Figure 1 Forest plots for overall survival rates after surgical resection.
A: Meta-analysis of 1-year overall survival outcomes; B: Meta-analysis of 5-year overall survival outcomes.
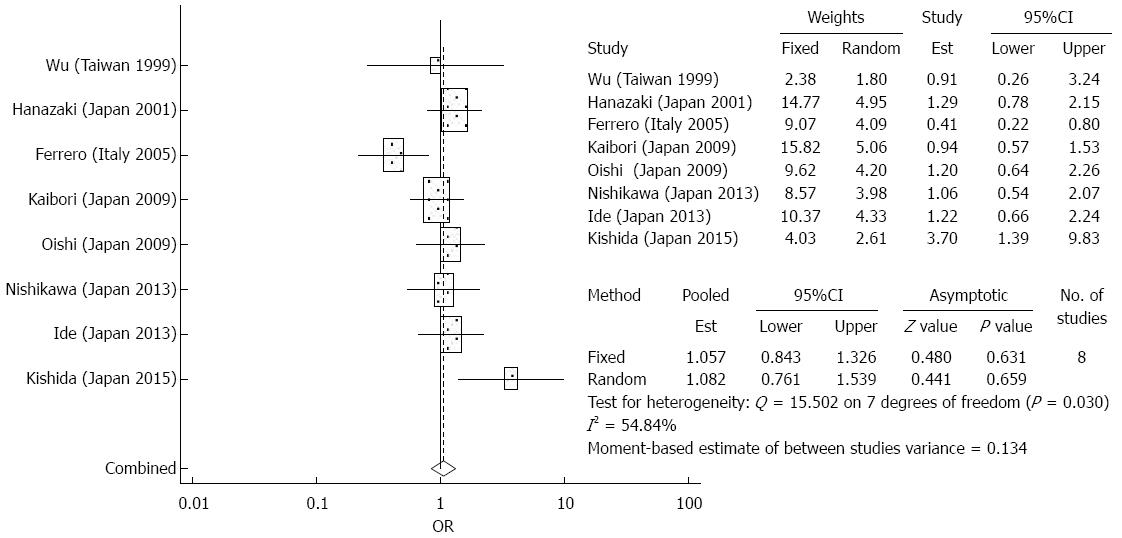
Figure 2 Forest plot demonstrating meta-analysis of 5-year disease free survival after surgical resection.
Figure 3 Forest plot demonstrating meta-analysis of treatment complications of surgical resection.
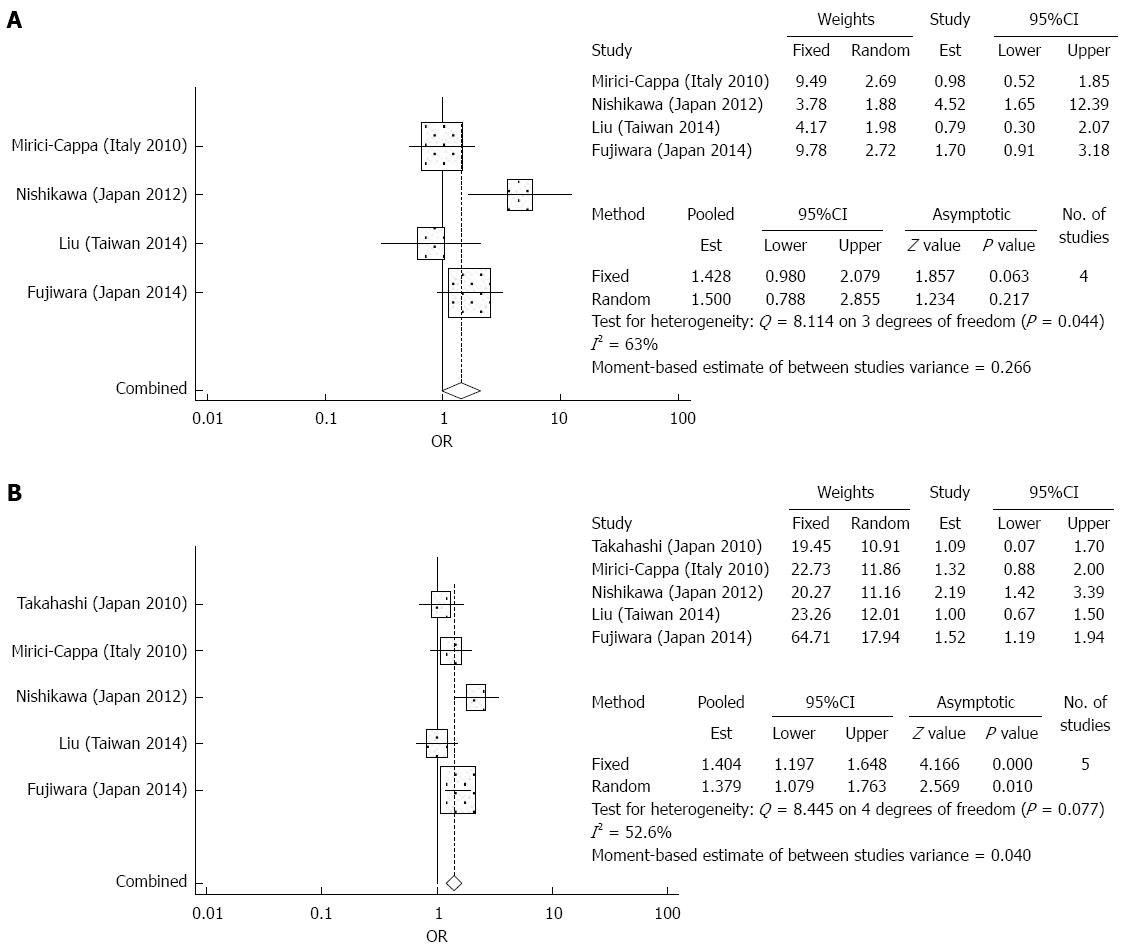
Figure 4 Forest plots for overall survival rates after radiofrequency ablation.
A: Meta-analysis of 1-year overall survival outcomes; B: Meta-analysis of 5-year overall survival outcomes.
Figure 5 Forest plot for treatment complications after radiofrequency ablation.
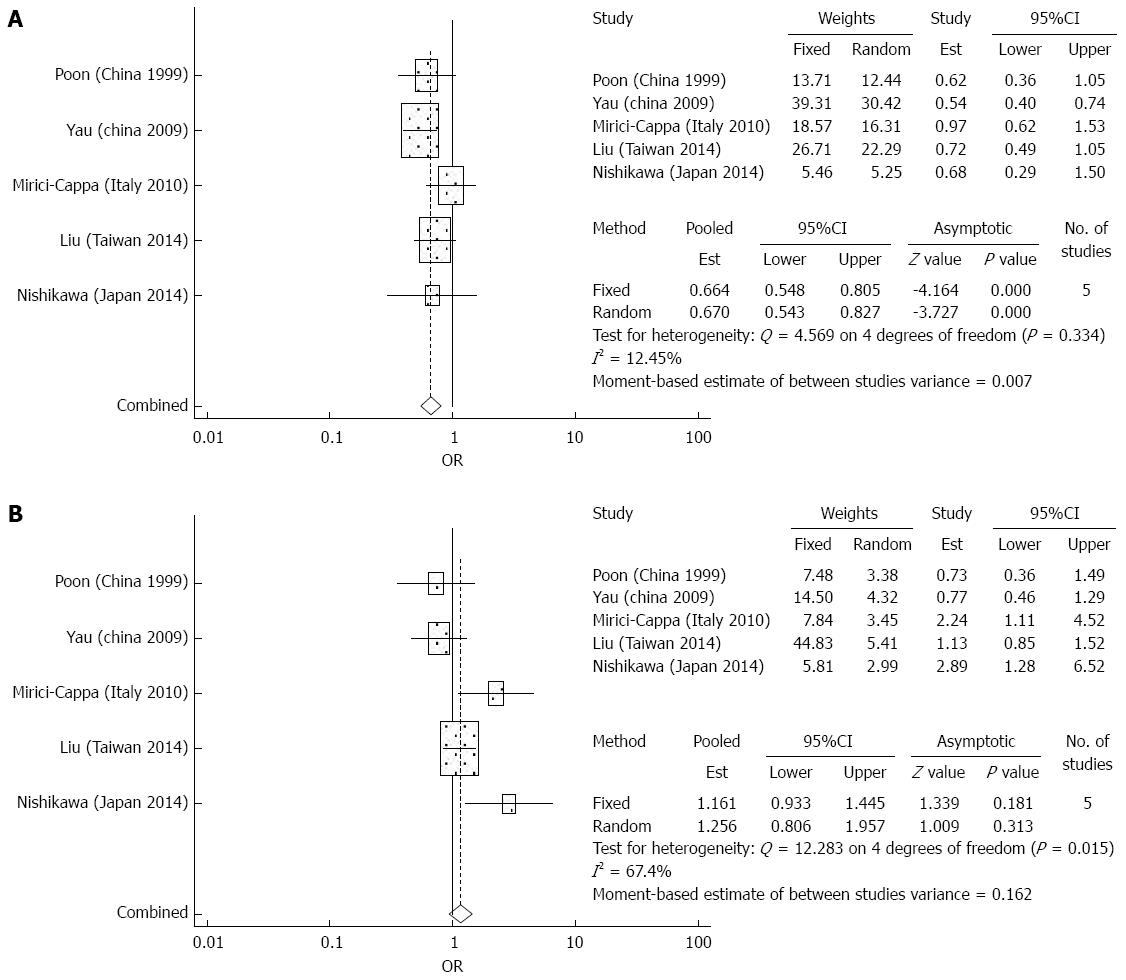
Figure 6 Forest plots for overall survival rates after transarterial chemoembolization.
A: Meta-analysis of 1-year overall survival outcomes; B: Meta-analysis of 5-year overall survival outcomes.
Figure 7 Forest plot for treatment complications after transarterial chemoembolization.
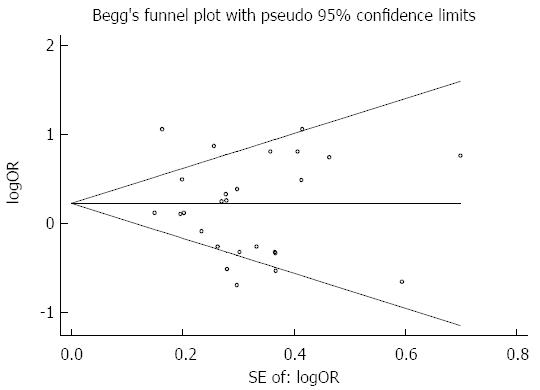
Figure 8 Begg’s funnel plot with standard error as the X axis and the log of the odds ratio as the Y axis.
- Citation: Hung AK, Guy J. Hepatocellular carcinoma in the elderly: Meta-analysis and systematic literature review. World J Gastroenterol 2015; 21(42): 12197-12210
- URL: https://www.wjgnet.com/1007-9327/full/v21/i42/12197.htm
- DOI: https://dx.doi.org/10.3748/wjg.v21.i42.12197


