Copyright
©The Author(s) 2015.
World J Gastroenterol. Oct 14, 2015; 21(38): 10874-10882
Published online Oct 14, 2015. doi: 10.3748/wjg.v21.i38.10874
Published online Oct 14, 2015. doi: 10.3748/wjg.v21.i38.10874
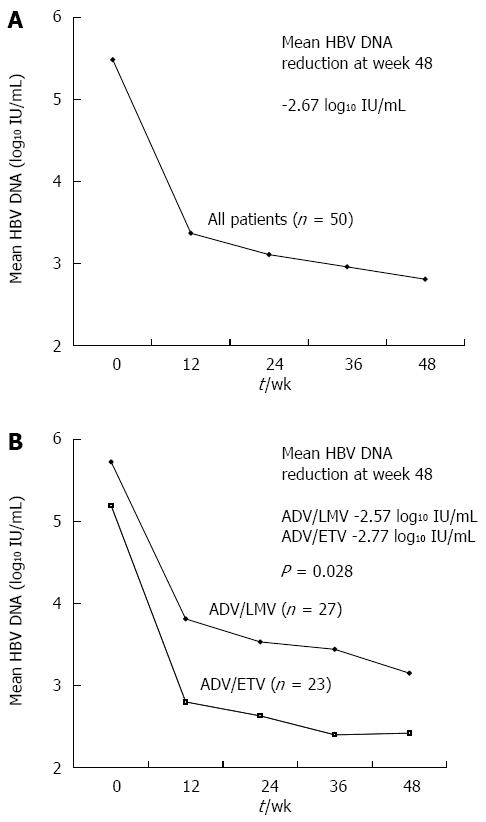
Figure 1 Changes of hepatitis B virus DNA levels during 48 wk.
A: The overall mean changes of hepatitis B virus (HBV) DNA levels from baseline; B: The mean reduction of serum HBV DNA levels in adefovir plus entecavir (ADV/ETV) combination group and in the adefovir plus lamivudine (ADV/LMV) combination group.
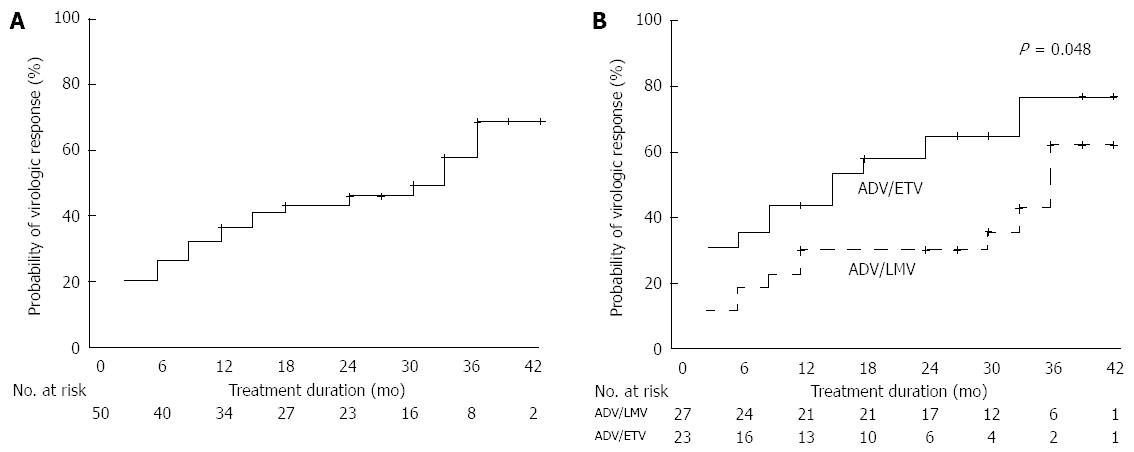
Figure 2 Virologic responses according to type of treatments up to 36 mo.
A: Overall cumulative virologic response rates at 6, 12, 24, and 36 mo; B: Cumulative virologic response rates in the adefovir plus entecavir (ADV/ETV) combination group and in the adefovir plus lamivudine (ADV/LMV) combination group (P = 0.048).
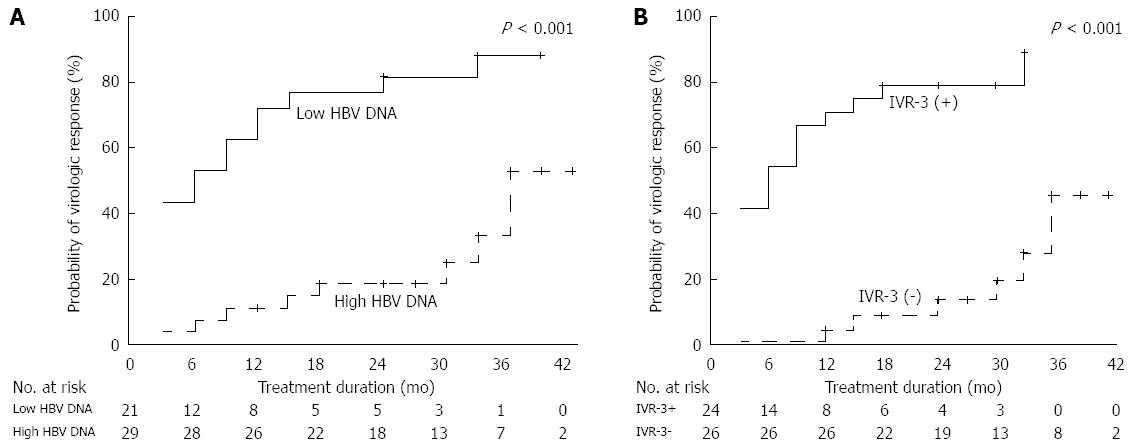
Figure 3 Virologic responses according to the presence of favorable factors.
A: Cumulative virologic response rates in patients with low baseline serum hepatitis B virus (HBV) DNA levels and in patients with high baseline serum HBV DNA levels (P < 0.001); B: Cumulative virologic response rates in patients with and without initial virologic response-3 (IVR-3) (P < 0.001).
Figure 4 Virologic responses according to the number of predictive factors.
Cumulative virologic response rates in patients with 2, 1, and 0 favorable factors are presented (P < 0.001).
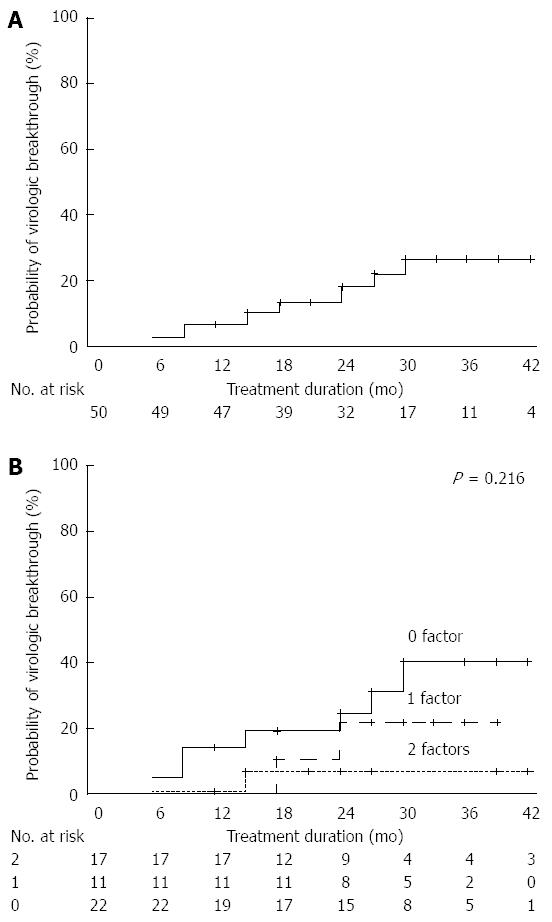
Figure 5 Development of virological breakthrough.
A: Overall cumulative virological breakthrough (VBT) rates; B: Cumulative incidence of VBT at 36 mo according to the number of favorable predictors.
- Citation: Kim HS, Yim HJ, Jang MK, Park JW, Suh SJ, Seo YS, Kim JH, Kim BH, Park SJ, Lee SH, Kim SG, Kim YS, Lee JI, Lee JW, Kim IH, Kim TY, Kim JW, Jeong SH, Jung YK, Park H, Group SGHOBOARS. Management of entecavir-resistant chronic hepatitis B with adefovir-based combination therapies. World J Gastroenterol 2015; 21(38): 10874-10882
- URL: https://www.wjgnet.com/1007-9327/full/v21/i38/10874.htm
- DOI: https://dx.doi.org/10.3748/wjg.v21.i38.10874


