Copyright
©The Author(s) 2015.
World J Gastroenterol. Oct 14, 2015; 21(38): 10853-10865
Published online Oct 14, 2015. doi: 10.3748/wjg.v21.i38.10853
Published online Oct 14, 2015. doi: 10.3748/wjg.v21.i38.10853
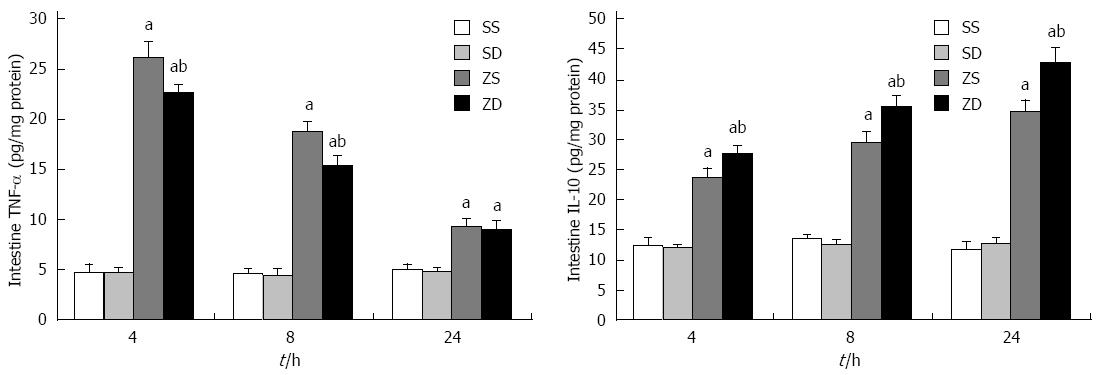
Figure 1 Tumor necrosis factor-α and interleukin-10 levels in rat intestine at 4, 8, and 24 h after intraperitoneal injection of zymosan.
Intestine samples were obtained at 4, 8, and 24 h after intraperitoneal injection of zymosan. Data are expressed as mean ± SD (n = 8 per group at each time point). aP < 0.05 vs group SS and group SD; bP < 0.05 vs group ZS. TNF-α: Tumor necrosis factor-α; IL-10: Interleukin-10; DMSO: Dimethyl sulfoxide; SS: Sham with administration of normal saline; SD: Sham with administration of DMSO; ZS: Zymosan with administration of normal saline; ZD: Zymosan with administration of DMSO.
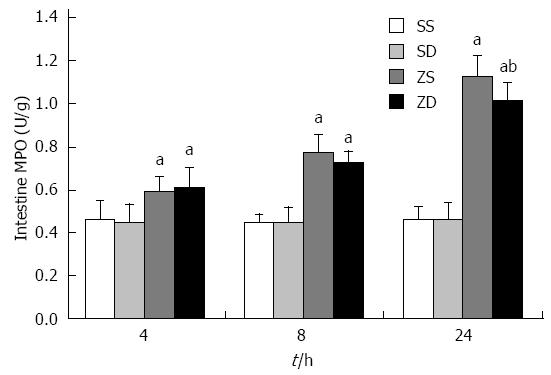
Figure 2 Activity of intestinal myeloperoxidase.
Data are expressed as mean ± SD. aP < 0.05 vs group SS and group SD, bP < 0.05 vs group ZS (n = 8 per group at each time point). MPO: Myeloperoxidase; DMSO: Dimethyl sulfoxide; SS: Sham with administration of normal saline; SD: Sham with administration of DMSO; ZS: Zymosan with administration of normal saline; ZD: Zymosan with administration of DMSO.
Figure 3 Activity of superoxide dismutase and the content of malonaldehyde in rat intestine.
Data are expressed as mean ± SD. aP < 0.05 vs group SS and group SD, bP < 0.05 vs group ZS (n = 8 per group at each time point). SOD: Superoxide dismutase; MDA: Malonaldehyde; DMSO: Dimethyl sulfoxide; SS: Sham with administration of normal saline; SD: Sham with administration of DMSO; ZS: Zymosan with administration of normal saline; ZD: Zymosan with administration of DMSO.
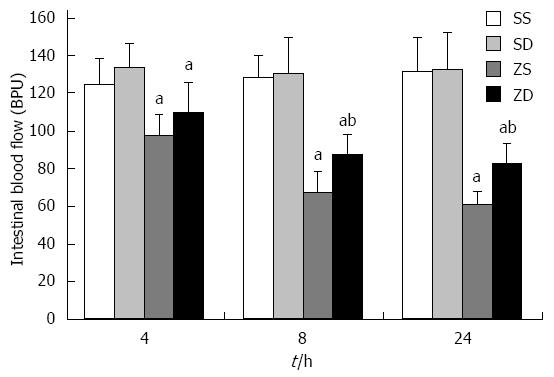
Figure 4 Effect of DMSO on intestinal mucosal blood flow.
Data are expressed as mean ± SD (n = 8 per group at each time point).aP < 0.05 vs group SS and group SD; bP < 0.05 vs group ZS. IMBF: Intestinal mucosal blood flow; DMSO: Dimethyl sulfoxide; SS: Sham with administration of normal saline; SD: Sham with administration of DMSO; ZS: Zymosan with administration of normal saline; ZD: Zymosan with administration of DMSO.
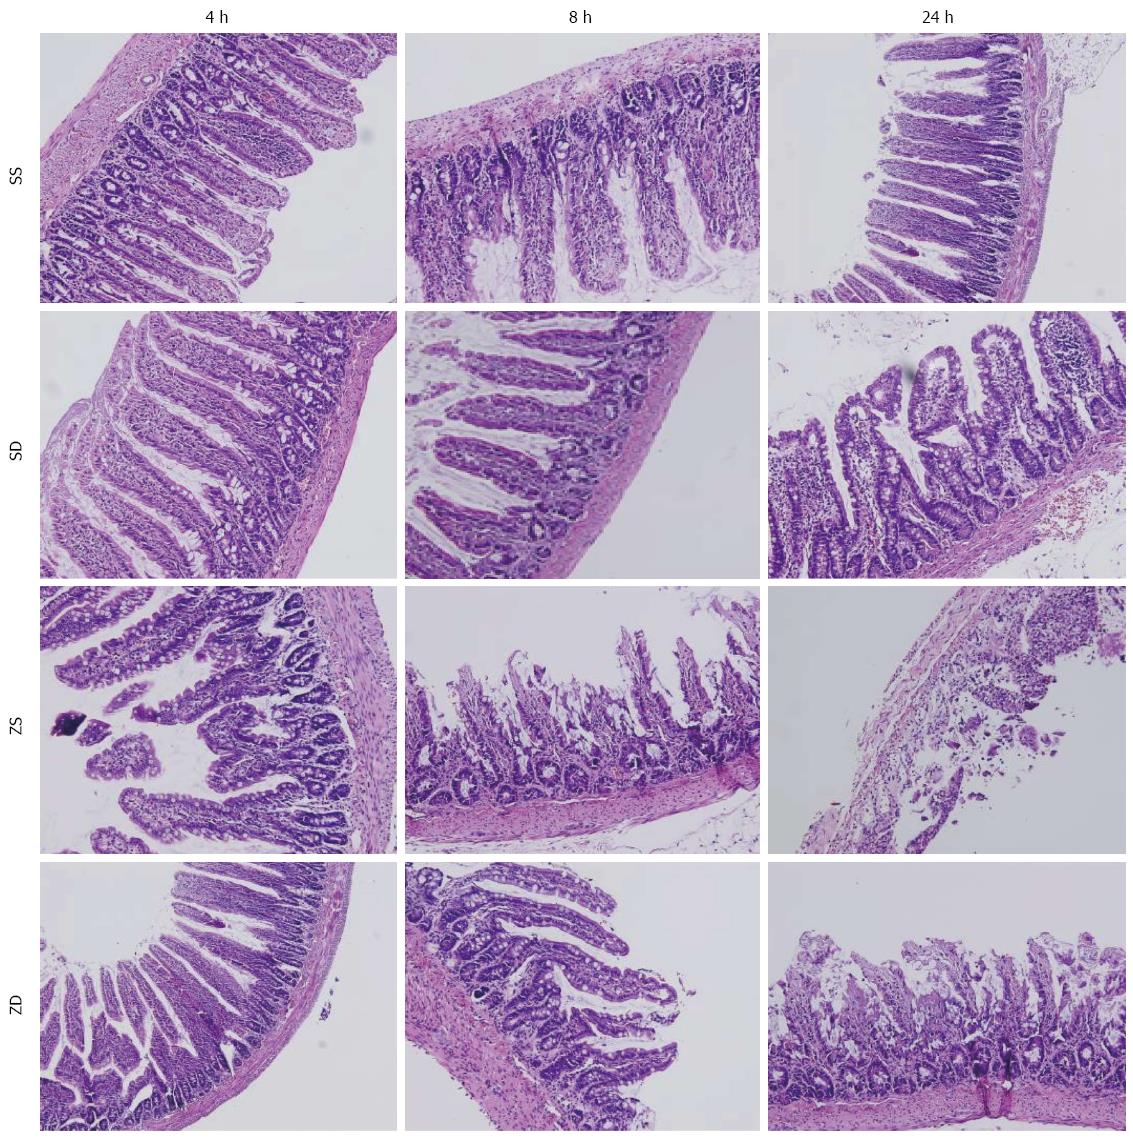
Figure 5 Intestinal histology.
Dimethyl sulfoxide protected against intestinal injury following intraperitoneal injection of zymosan. Sections of the distal ileum were harvested at 4, 8, and 24 h after intraperitoneal injection of zymosan and stained with hematoxylin and eosin. All images were obtained at × 200 magnification with the black bar = 5 μm (n = 8 per group). DMSO: Dimethyl sulfoxide; SS: Sham with administration of normal saline; SD: Sham with administration of DMSO; ZS: Zymosan with administration of normal saline; ZD: Zymosan with administration of DMSO.
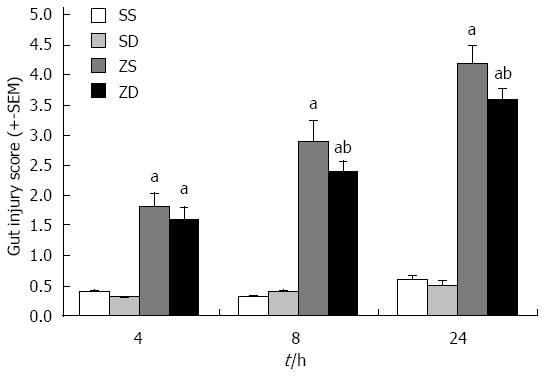
Figure 6 Gut injury scores.
Gut injury was scored by a pathologist blinded to the experimental groups on a scale of 0-4, (as described in Materials and Methods). aP < 0.05 vs group SS and group SD, bP < 0.05 vs group ZS (n = 8 per group at 4, 8, and 24 h after intraperitoneal injection of zymosan). DMSO: Dimethyl sulfoxide; SS: Sham with administration of normal saline; SD: Sham with administration of DMSO; ZS: Zymosan with administration of normal saline; ZD: Zymosan with administration of DMSO.
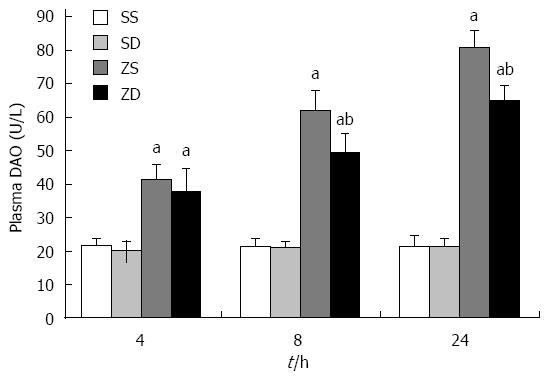
Figure 7 Effect of dimethyl sulfoxide on diamine oxidase in plasma.
Blood samples and intestinal samples were obtained at 4, 8, and 24 h after intraperitoneal administration of zymosan. DMSO protected the intestine from an increase in permeability. aP < 0.05 vs group SS and group SD, bP < 0.05 vs group ZS. DAO: Diamine oxidase; DMSO: Dimethyl sulfoxide; SS: Sham with administration of normal saline; SD: Sham with administration of DMSO; ZS: Zymosan with administration of normal saline; ZD: Zymosan with administration of DMSO.
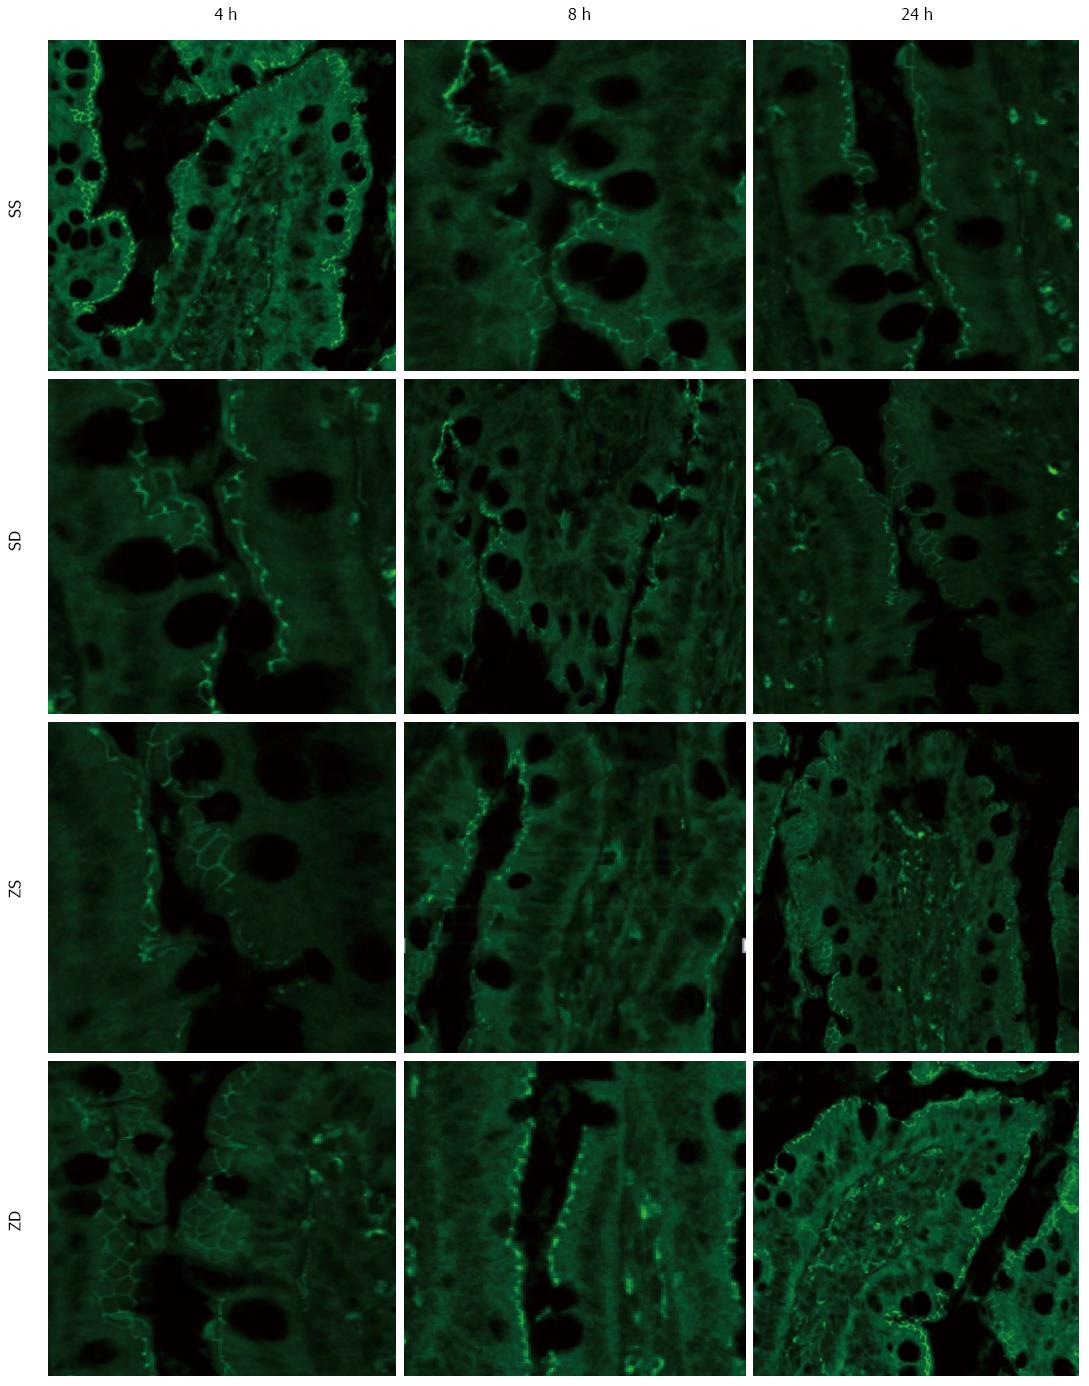
Figure 8 Intestinal ZO-1 immunofluorescent staining at 4 h, 8 h, and 24 h after injection of zymosan.
Animals in group ZS showed low fluorescent intensity at the cell periphery after intraperitoneal injection of zymosan, and DMSO administration resulted in preservation of ZO-1 staining. All images were taken at × 400 magnification with the black bar = 5 μm (n = 5 per group). DMSO: Dimethyl sulfoxide; SS: Sham with administration of normal saline; SD: Sham with administration of DMSO; ZS: Zymosan with administration of normal saline; ZD: Zymosan with administration of DMSO.
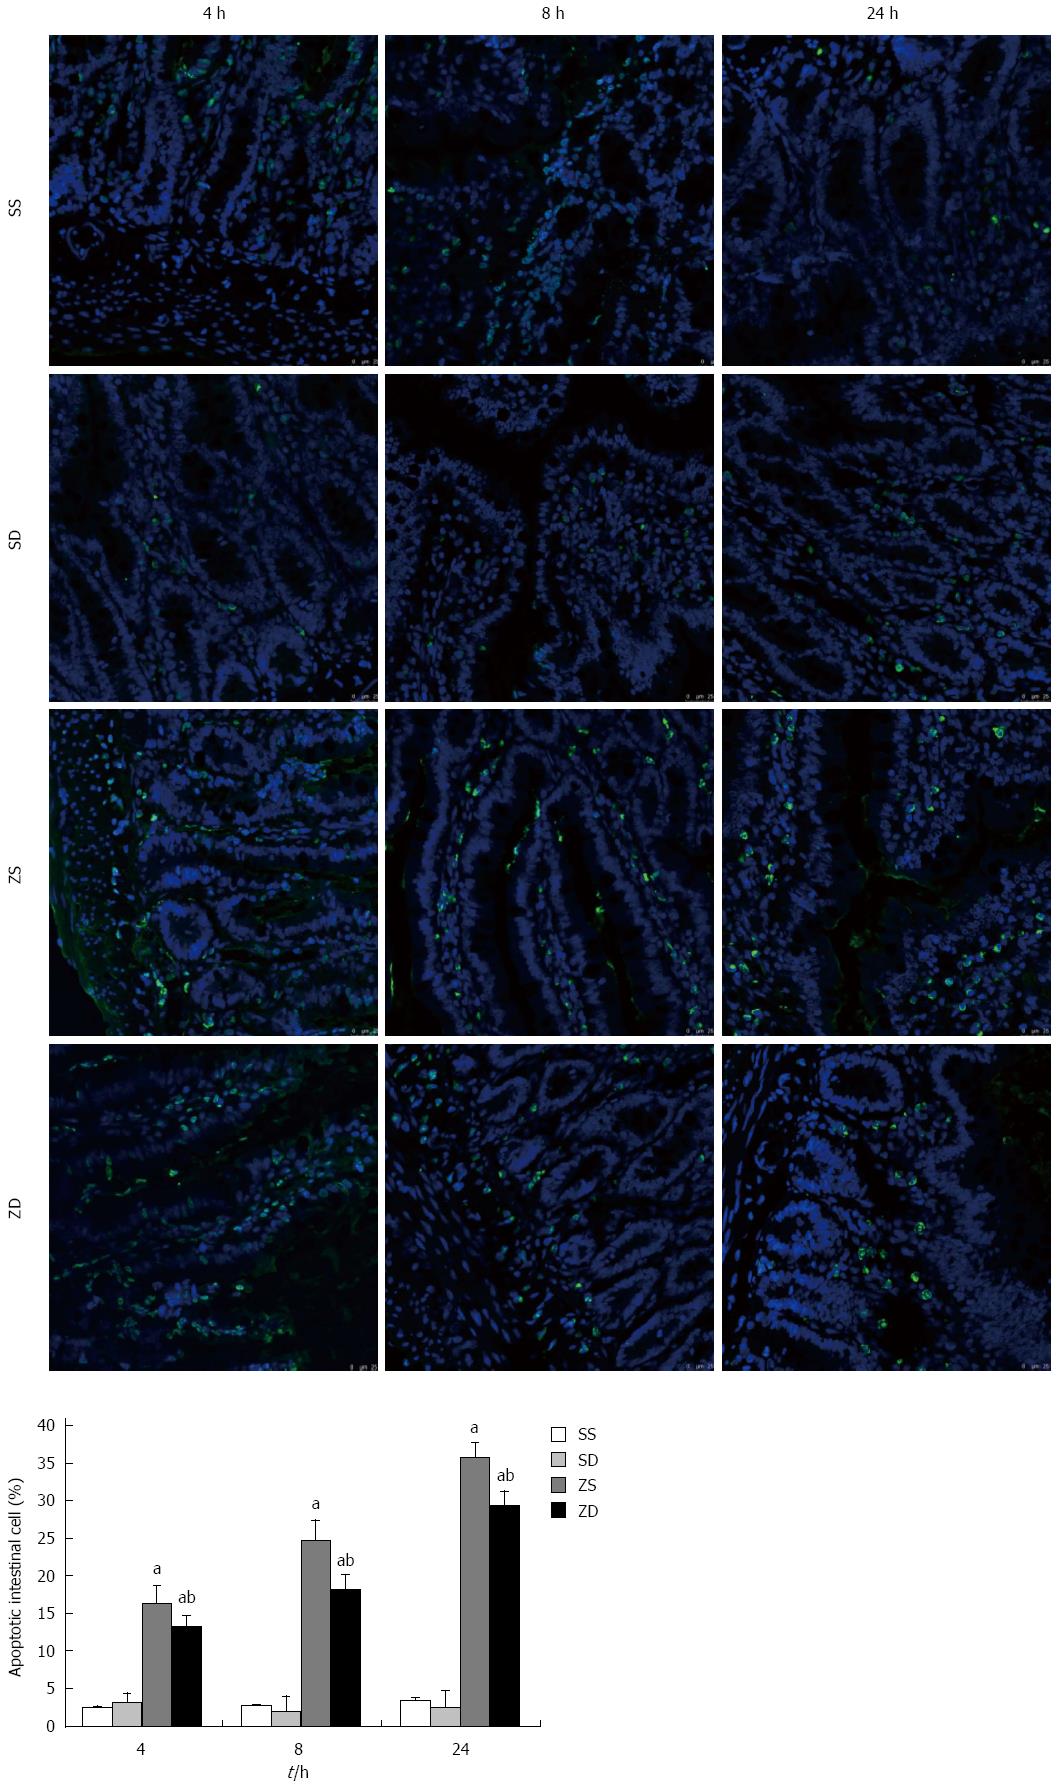
Figure 9 Effect of dimethyl sulfoxide on the percentage of apoptotic intestinal cells by the TUNEL assay.
TUNEL stained paraffin sections from rats at 4, 8, and 24 h (original magnification, × 400). Dimethyl sulfoxide inhibited intestinal cell apoptosis. aP < 0.05 vs group ZD, bP < 0.05 vs group ZS. DMSO: Dimethyl sulfoxide; SS: Sham with administration of normal saline; SD: Sham with administration of DMSO; ZS: Zymosan with administration of normal saline; ZD: Zymosan with administration of DMSO.
- Citation: Li YM, Wang HB, Zheng JG, Bai XD, Zhao ZK, Li JY, Hu S. Dimethyl sulfoxide inhibits zymosan-induced intestinal inflammation and barrier dysfunction. World J Gastroenterol 2015; 21(38): 10853-10865
- URL: https://www.wjgnet.com/1007-9327/full/v21/i38/10853.htm
- DOI: https://dx.doi.org/10.3748/wjg.v21.i38.10853


