Copyright
©The Author(s) 2015.
World J Gastroenterol. Sep 21, 2015; 21(35): 10137-10149
Published online Sep 21, 2015. doi: 10.3748/wjg.v21.i35.10137
Published online Sep 21, 2015. doi: 10.3748/wjg.v21.i35.10137
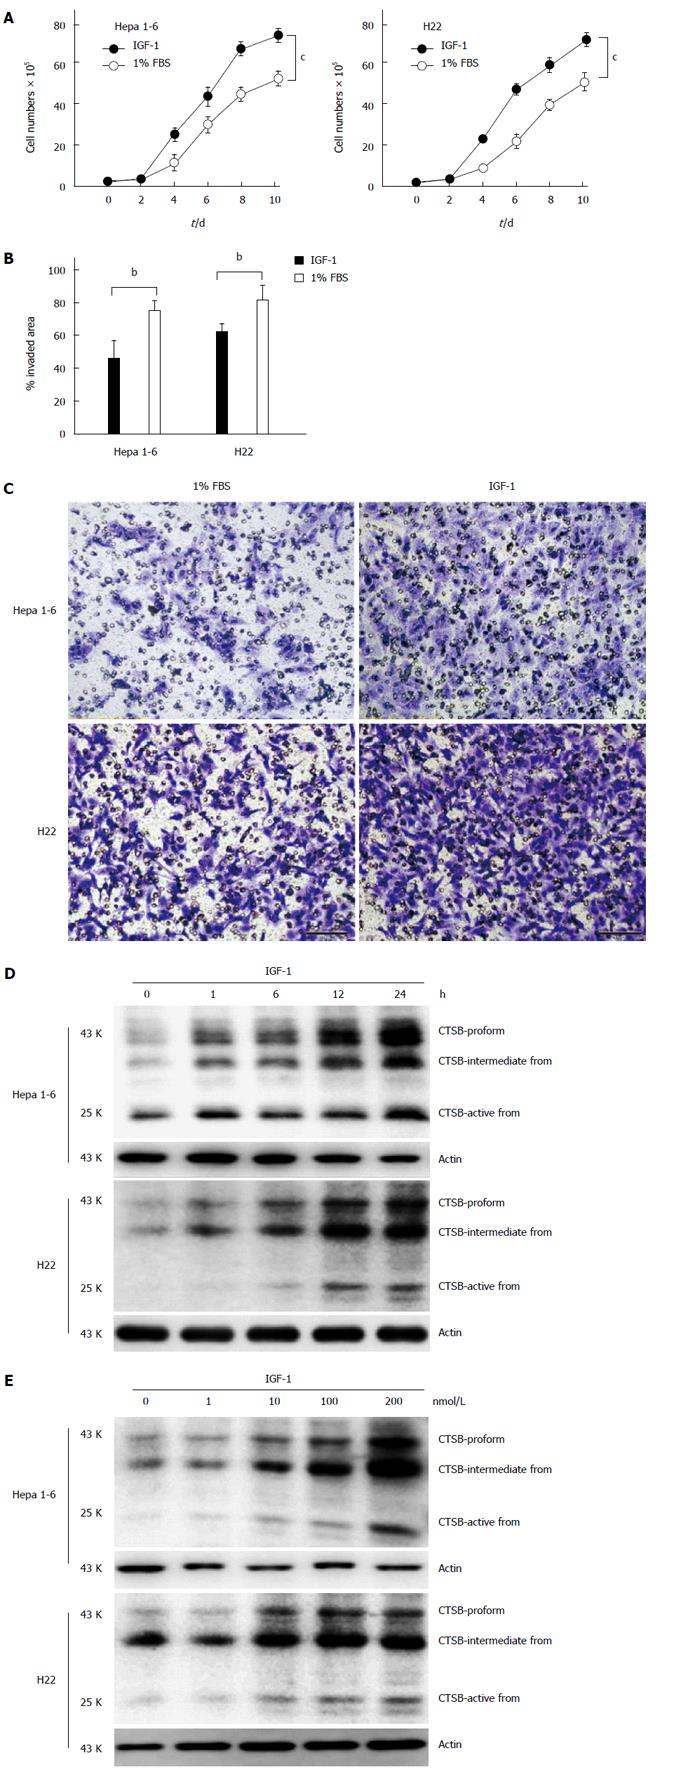
Figure 1 Cathepsin B mediates the IGF-1-induced hepatocellular carcinoma-promoting effect.
A: Hepa 1-6 and H22 cells were treated with IGF-1 (100 nmol/L) for 10 d. The data are presented as representative growth curves; B: Wound healing assay of Hepa 1-6 and H22 cells treated with IGF-1 for 24 h; C: IGF-1 induced Hepa 1-6 and H22 cell invasion. In total, 1 × 10⁵ Hepa 1-6 and H22 cells that had been treated with IGF-1 for 24 h were allowed to invade through Transwell inserts (8 μm) coated with Matrigel. The cells on the lower surface of the chambers were stained and imaged. The data are presented as a representative Transwell assay (scale bar, 20 μm); D and E: Hepa 1-6 and H22 cells were treated with IGF-1 (100 nmol/L) for the indicated times or treated with different IGF-1 concentrations for 12 h. CTSB expression was determined by immunoblotting. The data are presented as representative immunoblots. Student’s t-test. bP < 0.01; cP < 0.001, IGF-1 group vs 1% FBS group.
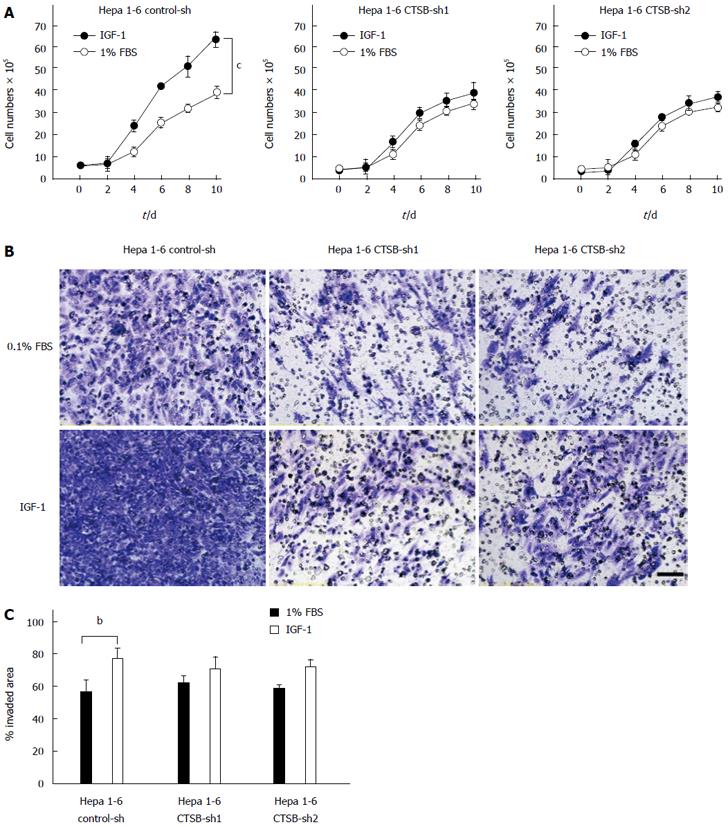
Figure 2 Cathepsin B depletion inhibited IGF-1-induced cancer cell growth and invasion.
A: Hep1-6 cells stably transfected with CTSB shRNA or control shRNA were treated with IGF-1 (100 nmol/L) for 10 d; The data are presented as representative growth curves; B: CTSB depletion inhibited IGF-1-induced cancer cell invasion. Hep1-6 cells stably transfected with CTSB shRNA or control shRNA were treated with IGF-1 (100 nmol/L) for 24 h. The data are presented as a representative Transwell assay (scale bar, 20 μm); C: Wound healing assay of Hepa 1-6 cells stably expressing CTSB shRNA cells or control shRNA treated with IGF-1 for 24 h. The data are presented as the mean ± SEM of 3 assays with triplicates. Student’s t-test. bP < 0.01, cP < 0.001, IGF-1 group vs 1% FBS group.
Figure 3 Cathepsin B mediated IGF-1-induced tumor growth and metastasis in diabetic mice.
A: Hepa 1-6 cells grew faster in diabetic mice than in normal mice. In total, 2 × 10⁶ Hepa 1-6 cells were injected s.c. into the backs of mice. The data are presented as quantified tumor weights (mean volumes ± SE); B: Metastasis developed rapidly in diabetic mice. In total, 3 × 10⁶ Hepa 1-6 cells were injected into the lateral tail vein of each mouse. The data are presented as representative bioluminescence images of lungs and metastatic nodule numbers in the lungs (mean ± SE); C: Hepa 1-6 cells expressing control shRNA or CTSB shRNA1 (2 × 10⁶) were injected sc into the backs of the mice. The data are presented as the mean volumes ± SEM at the indicated time points; D: Hepa 1-6 cells expressing control shRNA or CTSB shRNA1 (3 × 10⁶) were injected into the lateral tail vein of each mouse. The data are presented as the number of metastatic nodules in the lungs (mean ± SE). bP < 0.01; cP < 0.001 vs control.
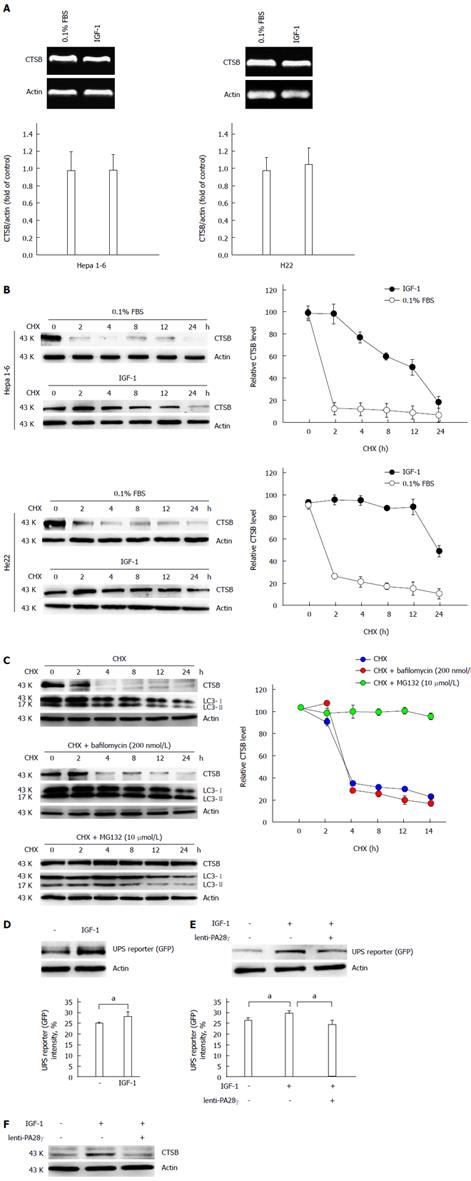
Figure 4 IGF-1 impeded cathepsin B degradation by inhibiting ubiquitin-proteasome system activity.
A: IGF-1 did not affect the mRNA level of cathepsin B (CTSB). Hep1-6 and H22 cells were treated with IGF-1 for 12 h. The mRNA expression levels of CTSB and actin were determined by RT-PCR; B: IGF-1 impeded CTSB degradation. Hep1-6 and H22 cells were incubated with CHX (10 g/mL) for the indicated time points after IGF-1 stimulation. CTSB and actin protein levels were detected by immunoblotting; C: CTSB degradation is dependent on ubiquitin-proteasome system (UPS) activity. Hep1-6 cells were treated with CHX plus an autophagy inhibitor (bafilomycin, 200 nmol/L) or UPS inhibitor (MG132, 10 μmol/L) at the indicated time points. Cell lysates were isolated for immunoblotting; D: IGF-1 inhibited UPS activity. Hep1-6 cells were transfected with UbG76V-GFP plasmid. At 24 h after the cells were transfected, they were treated with IGF-1 for another 12 h, and UbG76V-GFP expression was detected immunoblotting with anti-GFP antibody or by flow cytometry; E: PA28γ overexpression reversed the IGF-1-induced inhibition of UPS activity. Hepa 1-6 cells were infected with lentivirus containing PA28γ. After 24 h, the cells were treated with IGF-1 for 12 h. UbG76V-GFP expression was detected by immunoblotting with anti-GFP antibody or by flow cytometry; F: PA28γ overexpression recovered CTSB degradation. Hepa 1-6 cells were infected with lentivirus containing PA28γ. After 24 h, the cells were treated with IGF-1 for 12 h, and CTSB expression was detected by immunoblotting with anti-CTSB antibody. Data are presented as the mean ± SE of 3 independent assays. aP < 0.05.
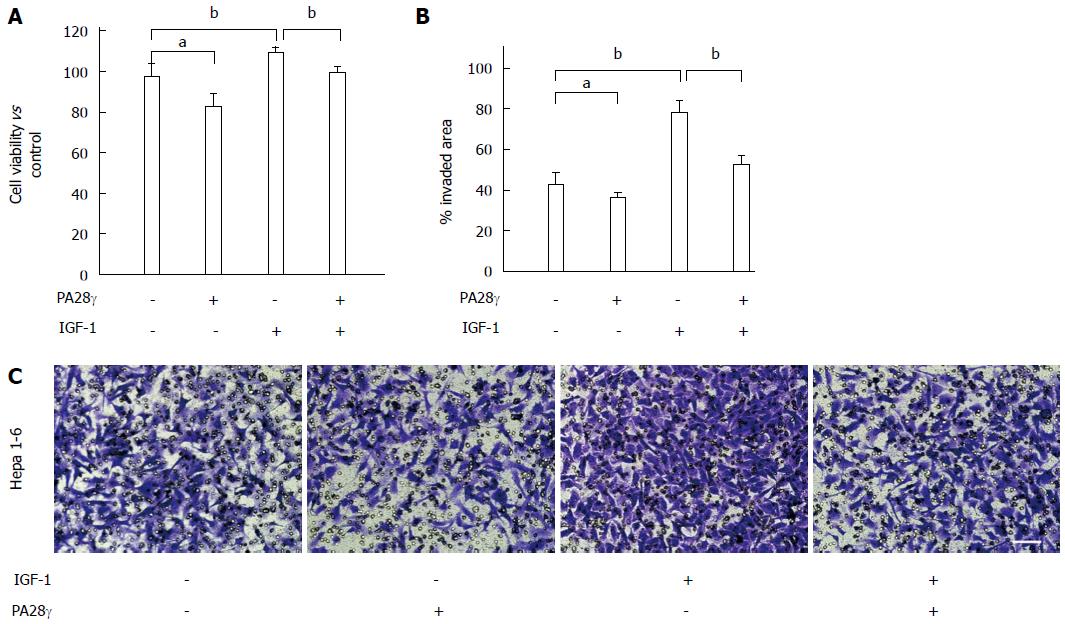
Figure 5 PA28γ overexpression inhibited IGF-1-induced cancer cell growth and invasion.
A: Hep1-6 cells infected with lentivirus PA28γ were treated with IGF-1 (100 nmol/L). MTT assay was detected on these cells; B: Wound healing assay of Hepa 1-6 cells overexpressing PA28γ treated with IGF-1 for 24 h; C: PA28γ overexpression inhibited IGF-1-induced cancer cell invasion. Hepa 1-6 cells were infected with lentivirus containing PA28γ. After 24 h, the cells were treated with IGF-1 for 12 h. The data are presented as a representative Transwell assay (scale bar, 20 μm). The data are presented as the mean ± SE of 3 assays. Student’s t-test. aP < 0.05; bP < 0.01.
-
Citation: Lei T, Ling X. IGF-1 promotes the growth and metastasis of hepatocellular carcinoma
via the inhibition of proteasome-mediated cathepsin B degradation. World J Gastroenterol 2015; 21(35): 10137-10149 - URL: https://www.wjgnet.com/1007-9327/full/v21/i35/10137.htm
- DOI: https://dx.doi.org/10.3748/wjg.v21.i35.10137


