Copyright
©The Author(s) 2015.
World J Gastroenterol. Sep 21, 2015; 21(35): 10080-10090
Published online Sep 21, 2015. doi: 10.3748/wjg.v21.i35.10080
Published online Sep 21, 2015. doi: 10.3748/wjg.v21.i35.10080
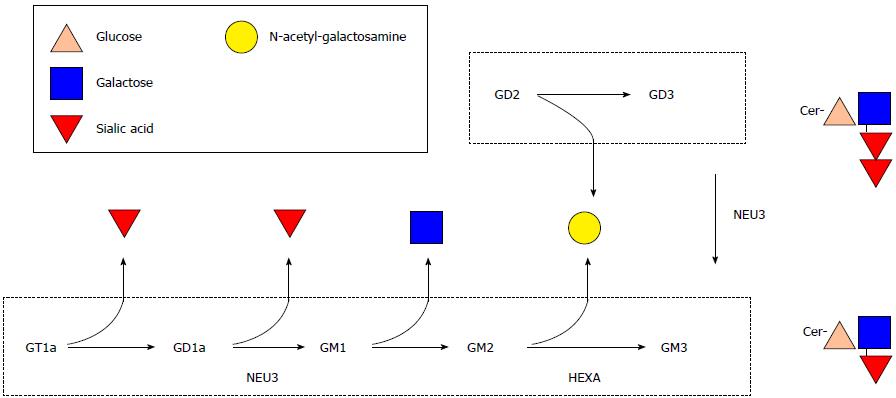
Figure 1 Biochemical pathway of ganglioside catabolism.
Pathway of ganglioside catabolism adapted from Miklavcic et al[15]. A-series gangliosides are highlighted in the upper boxed area and b-series gangliosides are highlighted in the lower boxed area. Enzyme catalyzing specific metabolic processes are adjacent to respective arrows. Cer: Ceramide; HEXA: Beta-hexosaminidase A; NEU3: Sialidase-3.
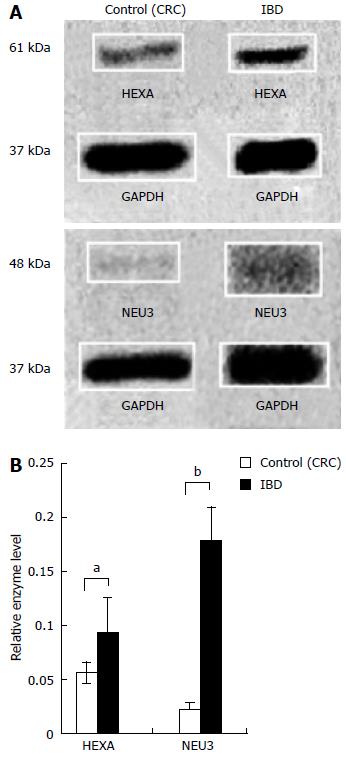
Figure 2 Ganglioside catabolism enzymes beta-hexosaminidase A and sialidase-3 are elevated in inflammatory bowel disease.
Figure 2A shows representative western blot of enzymes beta-hexosaminidase A (HEXA) and sialidase-3 (NEU3) which regulate ganglioside catabolism (n = 16). Bars in Figure 2B report the mean protein density (with standard error bars) of intestinal HEXA and NEU3 content expressed as a proportion relative to GAPDH (aP < 0.05, bP < 0.01 vs control). CRC: Colorectal cancer; GAPDH: Glyceraldehyde 3-phosphate dehydrogenase; IBD: Inflammatory bowel disease.
- Citation: Miklavcic JJ, Hart TD, Lees GM, Shoemaker GK, Schnabl KL, Larsen BM, Bathe OF, Thomson AB, Mazurak VC, Clandinin MT. Increased catabolism and decreased unsaturation of ganglioside in patients with inflammatory bowel disease. World J Gastroenterol 2015; 21(35): 10080-10090
- URL: https://www.wjgnet.com/1007-9327/full/v21/i35/10080.htm
- DOI: https://dx.doi.org/10.3748/wjg.v21.i35.10080


