Copyright
©The Author(s) 2015.
World J Gastroenterol. Sep 7, 2015; 21(33): 9808-9816
Published online Sep 7, 2015. doi: 10.3748/wjg.v21.i33.9808
Published online Sep 7, 2015. doi: 10.3748/wjg.v21.i33.9808
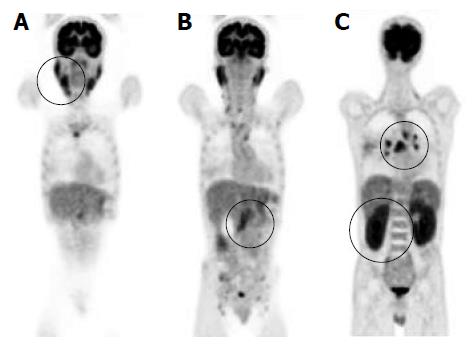
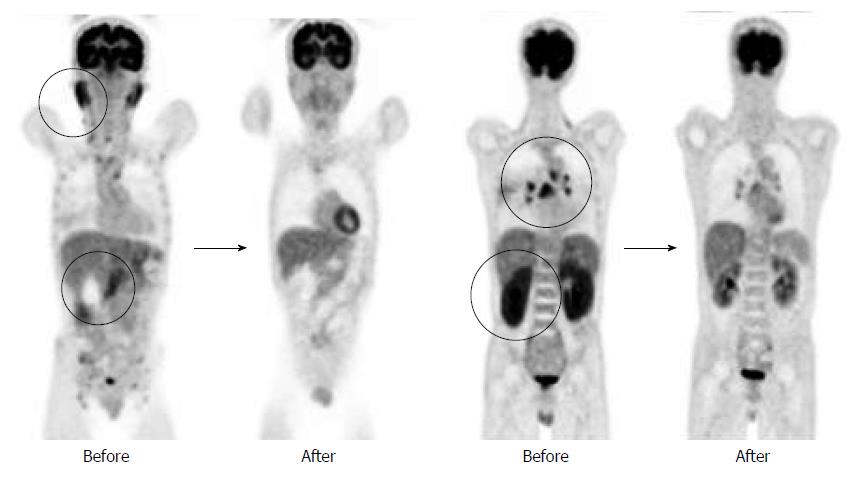
Figure 1 Findings of fluorodeoxyglucose-positron emission tomography.
Positron emission tomography revealed high fluorodeoxyglucose uptake in various organs (uptake is indicated by circles). A: Submandibular glands (SUVmax 5.6) and parotid glands (SUVmax 5.8); B: Pancreas (SUVmax 4.2); C: Bilateral hilar of lymph nodes (SUVmax 7.3) and both kidneys (SUVmax 6.2).
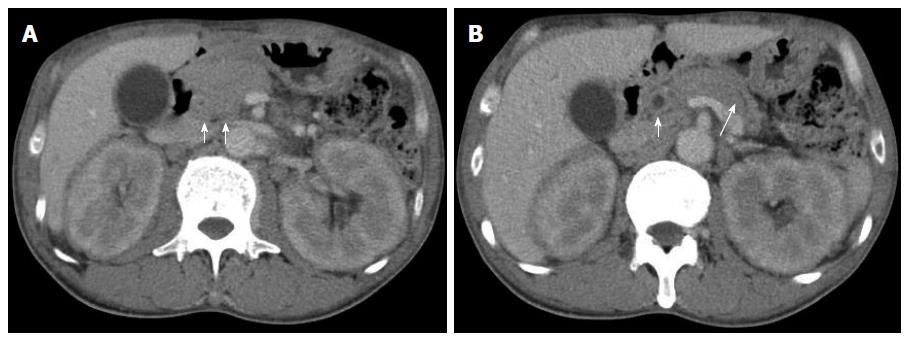
Figure 2 Findings of abdominal computed tomography.
A: Localized swelling of the head of the pancreas (short arrows); B: Mild dilation of the upstream main pancreatic duct (long arrow), a thickened common bile duct wall (short arrow), and swelling of the kidneys.
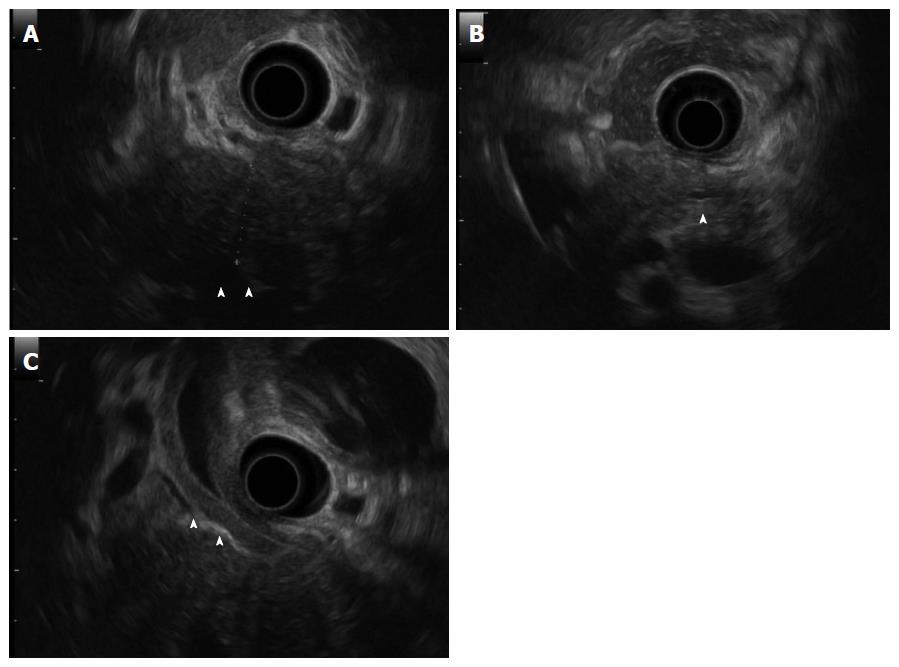
Figure 3 Findings of endoscopic ultrasonography.
Endoscopic ultrasonography revealed hypoechoic swelling of the pancreatic head (A: arrowheads), mild dilation of the upstream main pancreatic duct (B: arrowheads), and diffuse thickness of the common bile duct wall (C: arrowheads).
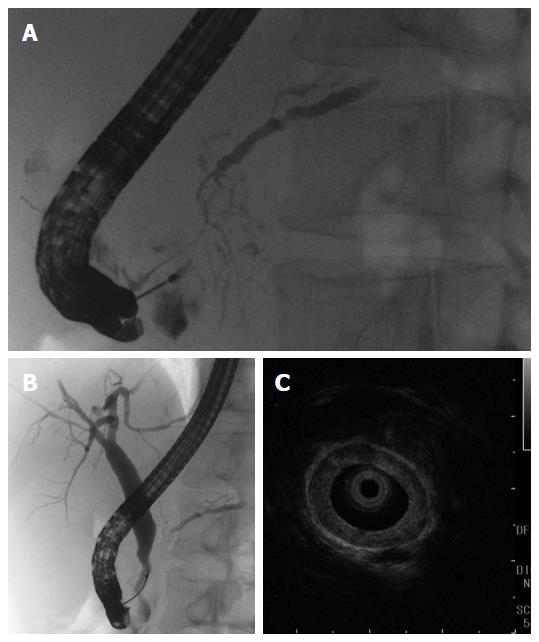
Figure 4 Findings of endoscopic retrograde cholangiopancreatography and intraductal ultrasonography.
Endoscopic retrograde cholangiopancreatography revealed an irregular narrowing of the main pancreatic duct (MPD) in the pancreatic head and dilation of the upstream MPD (A); There was a lower bile duct stricture (B); and intraductal ultrasonography showed diffuse thickening of the bile duct wall (C).
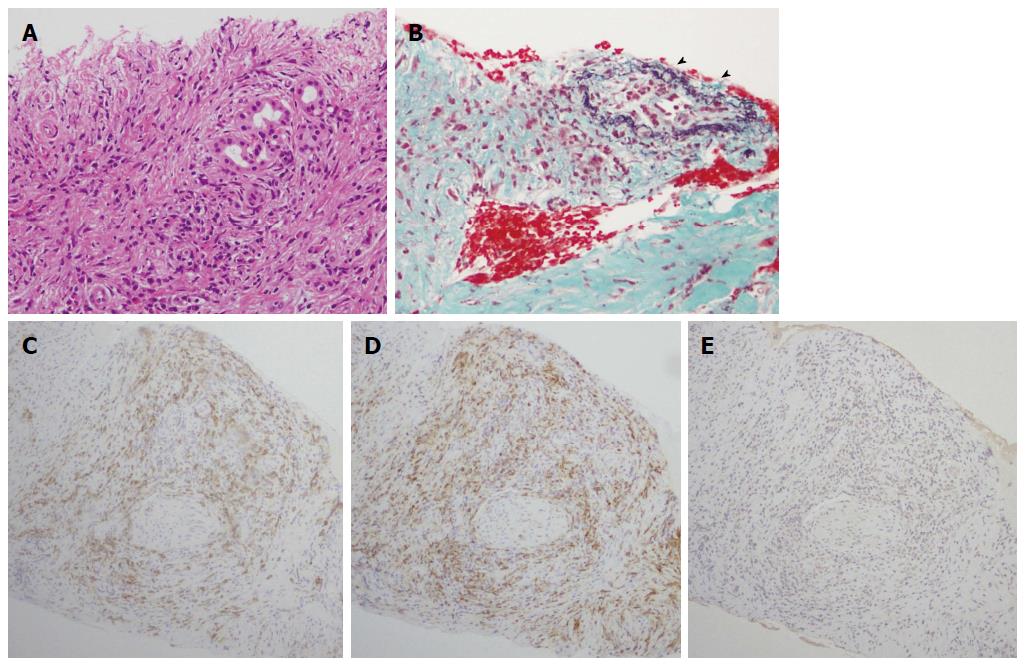
Figure 5 Histological findings of pancreas specimens.
The histological examination revealed marked lymphoplasmacytic infiltration, storiform fibrosis, and obliterative phlebitis (arrowheads). Immunostaining showed CD38-positive plasma cells and CD163-positive spindle macrophage infiltration. However, no IgG4-positive plasma cells were detected. A: Hematoxylin and eosin staining (magnification × 200 ); B: Elastica-Masson’s staining (magnification × 200); Immunohistochemical staining for CD38 (C), CD163 (D), and IgG4 (E) are also shown at magnification × 100.
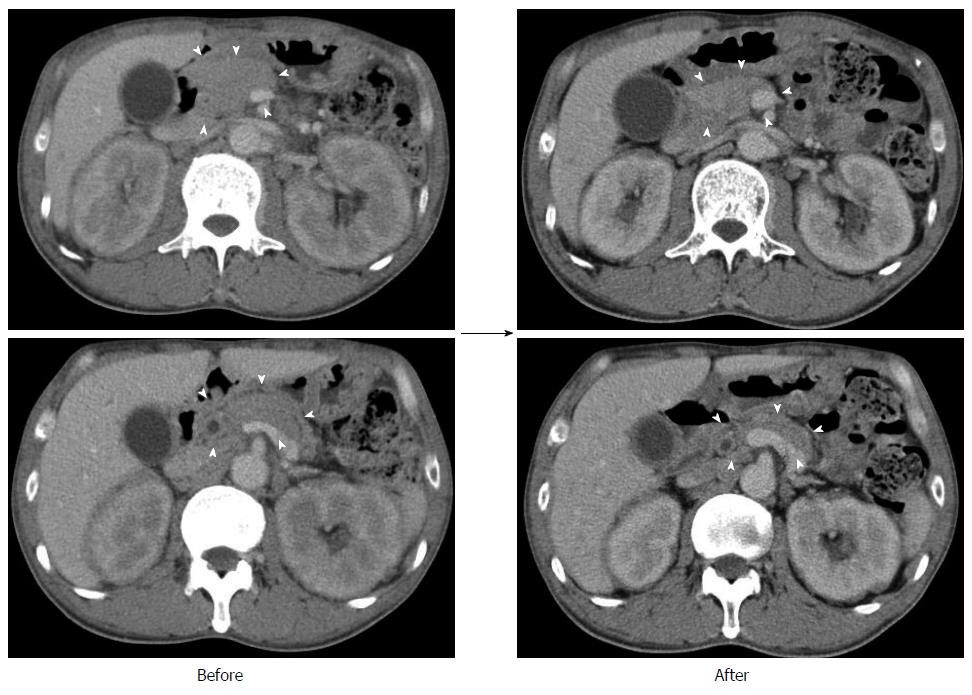
Figure 6 Findings of computed tomography after steroid therapy.
Computed tomography showed improved the enlargement of the pancreas (indicated arrowheads) and kidneys.
Figure 7 Findings of fluorodeoxyglucose-positron emission tomography after steroid therapy.
Fluorodeoxyglucose (FDG)-positron emission tomography showed reduced FDG uptake in various organs.
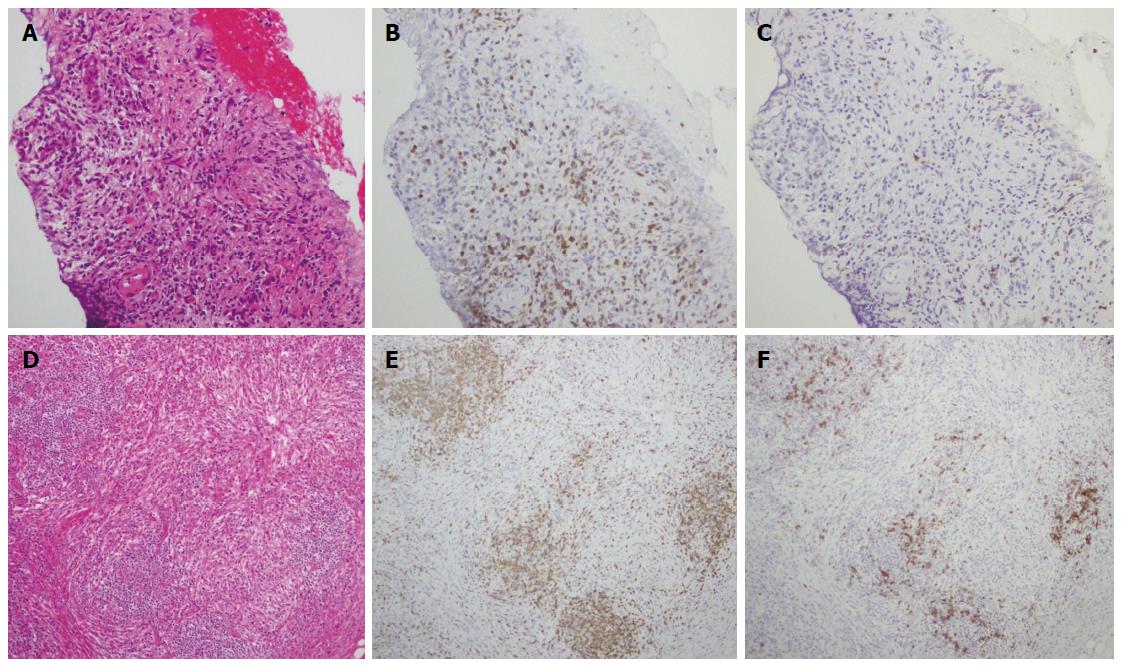
Figure 8 Histological findings of pancreas and salivary gland specimens.
Pancreas and salivary gland tissues exhibited increased CD3-positive T cell infiltration compared with CD20-positive B cell infiltration. A-C: Pancreas (magnification × 100); D-F: salivary gland (magnification × 100); A, D: Hematoxylin and eosin staining; B, C, E, F: Immunohistochemical staining for CD38 (B, E) and CD20 (C, F).
- Citation: Nakano E, Kanno A, Masamune A, Yoshida N, Hongo S, Miura S, Takikawa T, Hamada S, Kume K, Kikuta K, Hirota M, Nakayama K, Fujishima F, Shimosegawa T. IgG4-unrelated type 1 autoimmune pancreatitis. World J Gastroenterol 2015; 21(33): 9808-9816
- URL: https://www.wjgnet.com/1007-9327/full/v21/i33/9808.htm
- DOI: https://dx.doi.org/10.3748/wjg.v21.i33.9808


