Copyright
©The Author(s) 2015.
World J Gastroenterol. Sep 7, 2015; 21(33): 9749-9757
Published online Sep 7, 2015. doi: 10.3748/wjg.v21.i33.9749
Published online Sep 7, 2015. doi: 10.3748/wjg.v21.i33.9749
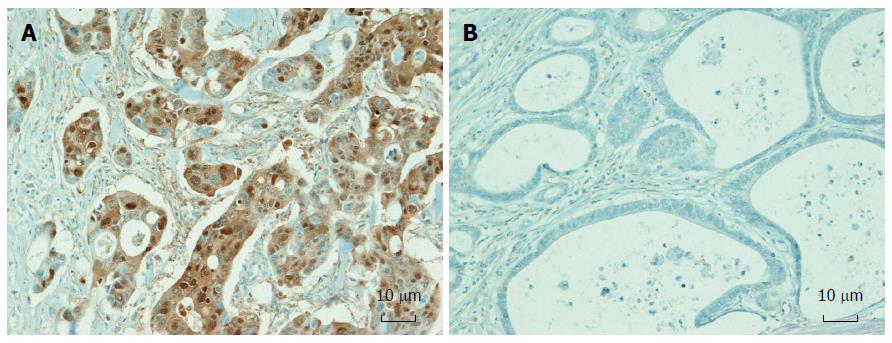
Figure 1 Representative images of immunohistochemical staining for Annexin A10.
A: Colorectal cancers (CRCs) with Annexin A10 expression (magnification × 200); B: CRCs without Annexin A10 expression (magnification × 200).
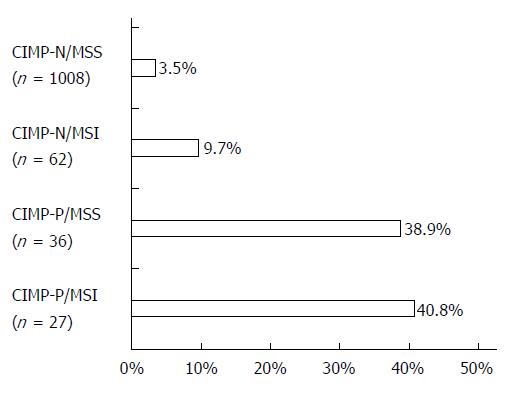
Figure 2 Frequency of Annexin A10 expression according to four molecular subtypes.
CIMP-N: CpG island methylator phenotype-negative; CIMP-P: CpG island methylator phenotype-positive; MSS: Microsatellite stable; MSI: Microsatellite instability.
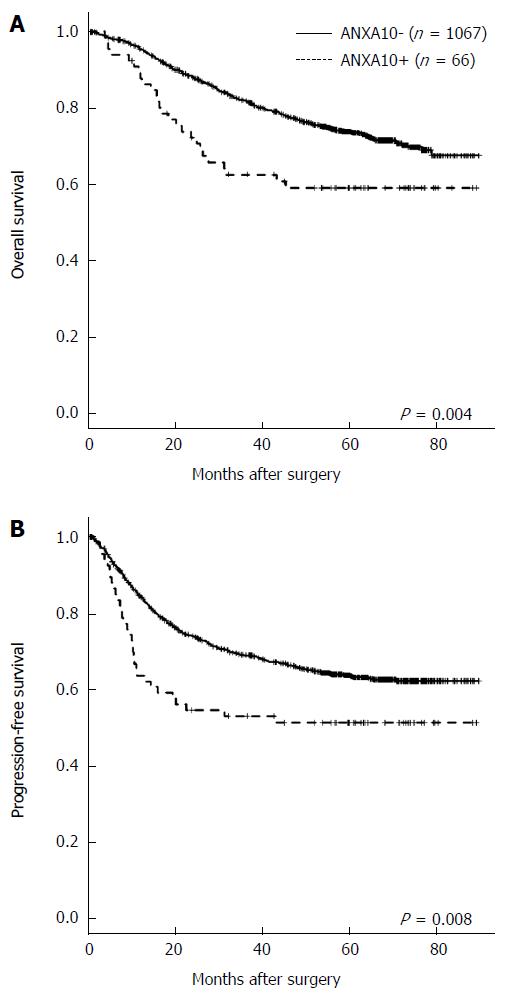
Figure 3 Univariate survival analysis in colorectal cancers according to Annexin A10 expression status.
A: Overall survival; B: Progression-free survival. ANXA10-; Annexin A10 no-expression, ANXA10+: Annexin A10 expression.
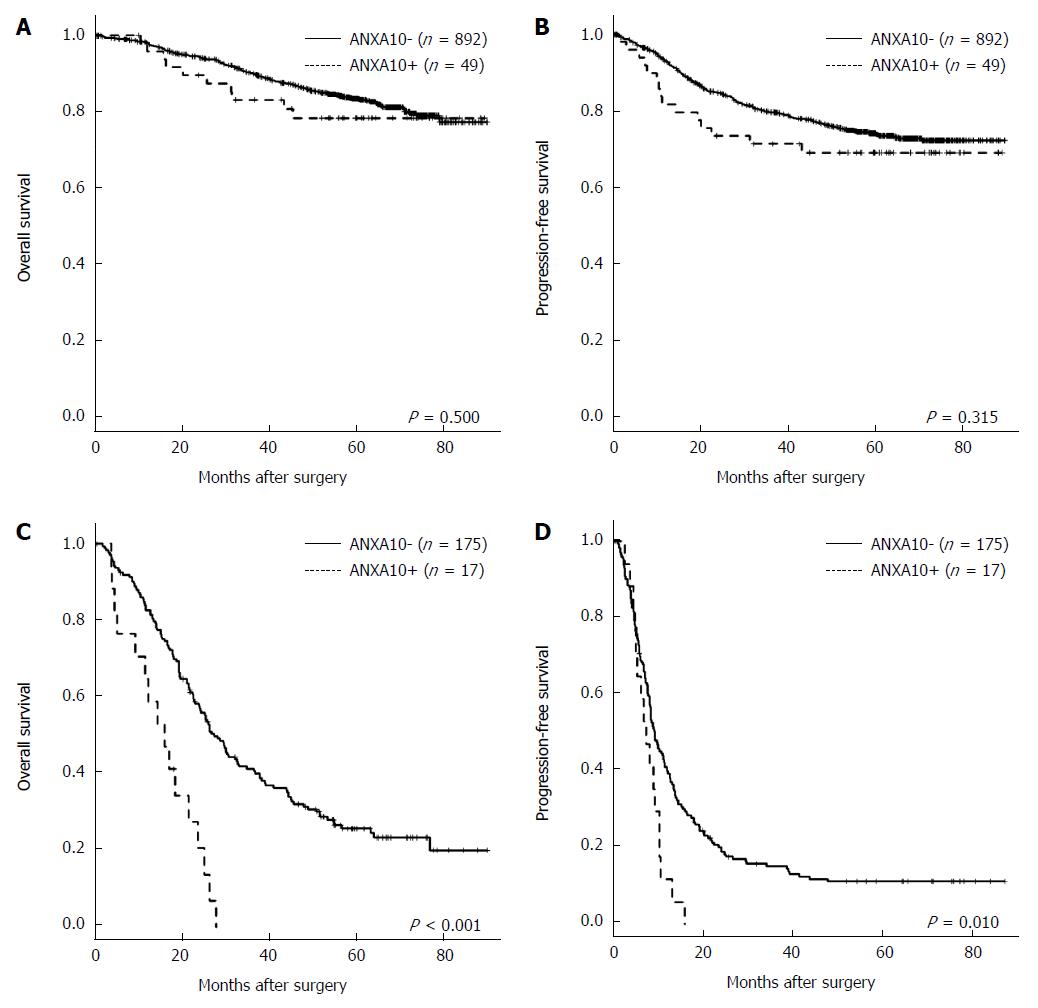
Figure 4 Stage-specific survival analysis according to Annexin A10 expression status.
A: Overall survival for Stages I-III colorectal cancers (CRCs); B: Progression-free survival of Stages I-III CRCs; C: Overall survival of Stage IV CRCs; D: Progression-free survival of Stage IV CRCs. ANXA10-; Annexin A10 no-expression, ANXA10+: Annexin A10 expression.
- Citation: Bae JM, Kim JH, Rhee YY, Cho NY, Kim TY, Kang GH. Annexin A10 expression in colorectal cancers with emphasis on the serrated neoplasia pathway. World J Gastroenterol 2015; 21(33): 9749-9757
- URL: https://www.wjgnet.com/1007-9327/full/v21/i33/9749.htm
- DOI: https://dx.doi.org/10.3748/wjg.v21.i33.9749


