Copyright
©The Author(s) 2015.
World J Gastroenterol. Sep 7, 2015; 21(33): 9741-9748
Published online Sep 7, 2015. doi: 10.3748/wjg.v21.i33.9741
Published online Sep 7, 2015. doi: 10.3748/wjg.v21.i33.9741
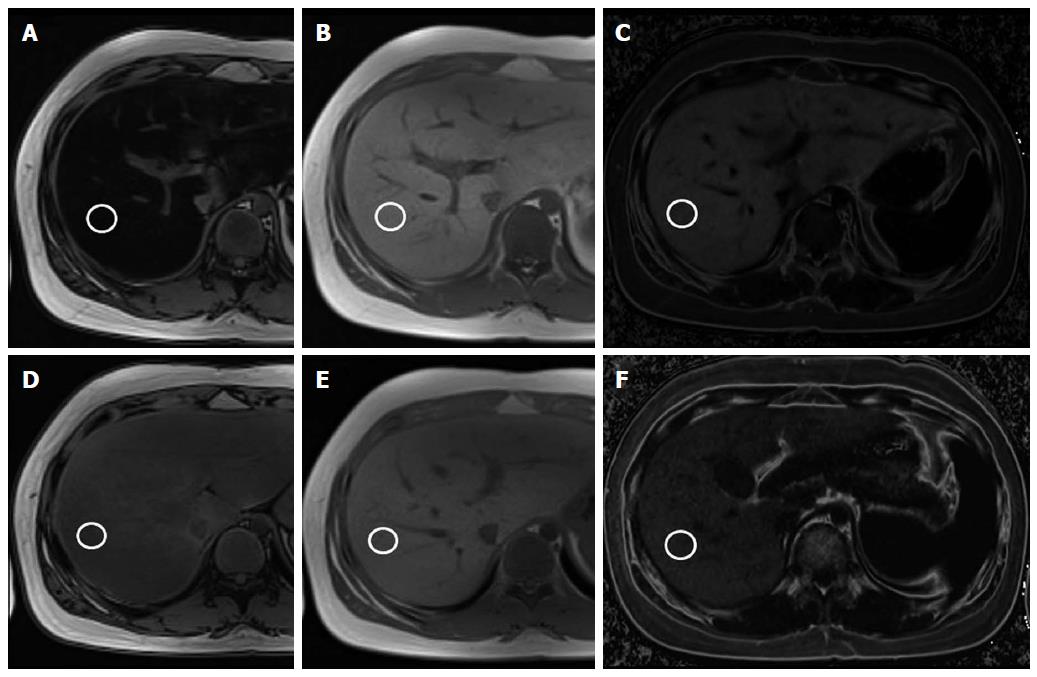
Figure 1 Liver fat quantification magnetic resonance in an 11-year-old boy in the compliant group.
The same circular regions of interest (white circles) are drawn to measure signal intensity in the liver parenchyma. On initial magnetic resonance (MR) images (A-C), signal intensity of the liver is 56.6 on the opposed-phase image (A) and 725.4 on the in-phase image (B). Therefore, the calculated fat signal percentage in the liver on the dual-echo sequence is 46% [(725.4-56.6) × 100/2 × 725.4]. The fat signal percentage in the liver is 34.4% on the fat map image (C) of the triple-echo sequence. On follow-up liver MR after treatment (D-F), hepatic signal intensity is 331.1 on the opposed-phase image (D) and 617.8 on the in-phase image (E), with a calculated fat signal percentage of 23% [(617.8-331.1) × 100/2 × 617.8] on the dual-echo sequence. The triple-echo sequence image also demonstrates a decreased hepatic fat signal percentage of 15% on the fat map image (F).
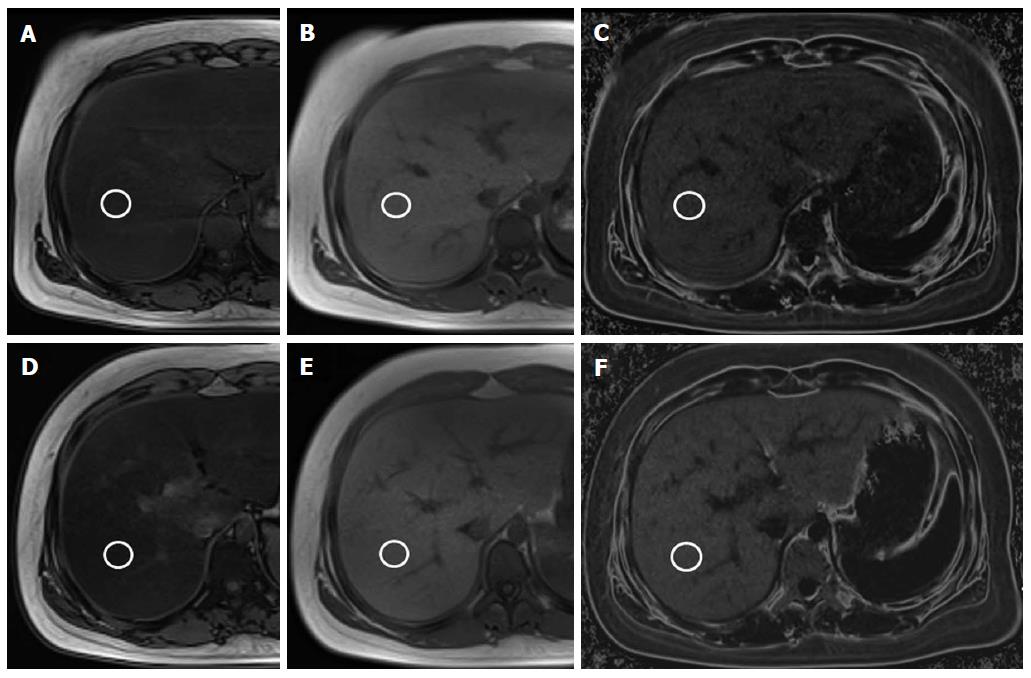
Figure 2 Liver fat quantification magnetic resonance in a 12-year-old girl in the non-compliant group.
The same circular regions of interest (white circles) are drawn to measure signal intensity in the liver parenchyma. On initial MR images (A-C), signal intensity of the liver is 299.1 on the opposed-phase image (A) and 644.6 on the in-phase image (B). Therefore, the calculated fat signal percentage in the liver on the dual-echo sequence is 26.8% [(644.6-299.1) × 100/2 × 644.6]. The fat signal percentage in the liver is 16.6% on the fat map image (C) of the triple-echo sequence. On follow-up liver MR after treatment (D-F), the fat signal is 238.6 on the opposed-phase image (D) and 750.6 on the in-phase image (E), with a calculated fat signal percentage of 34.1% [(750.6-238.6) × 100/2 × 750.6] on the dual-echo sequence. The triple-echo sequence image also demonstrates an increased hepatic fat signal percentage of 20.4% on the fat map image (F).
- Citation: Koh H, Kim S, Kim MJ, Kim HG, Shin HJ, Lee MJ. Hepatic fat quantification magnetic resonance for monitoring treatment response in pediatric nonalcoholic steatohepatitis. World J Gastroenterol 2015; 21(33): 9741-9748
- URL: https://www.wjgnet.com/1007-9327/full/v21/i33/9741.htm
- DOI: https://dx.doi.org/10.3748/wjg.v21.i33.9741


