Copyright
©The Author(s) 2015.
World J Gastroenterol. Aug 28, 2015; 21(32): 9675-9682
Published online Aug 28, 2015. doi: 10.3748/wjg.v21.i32.9675
Published online Aug 28, 2015. doi: 10.3748/wjg.v21.i32.9675
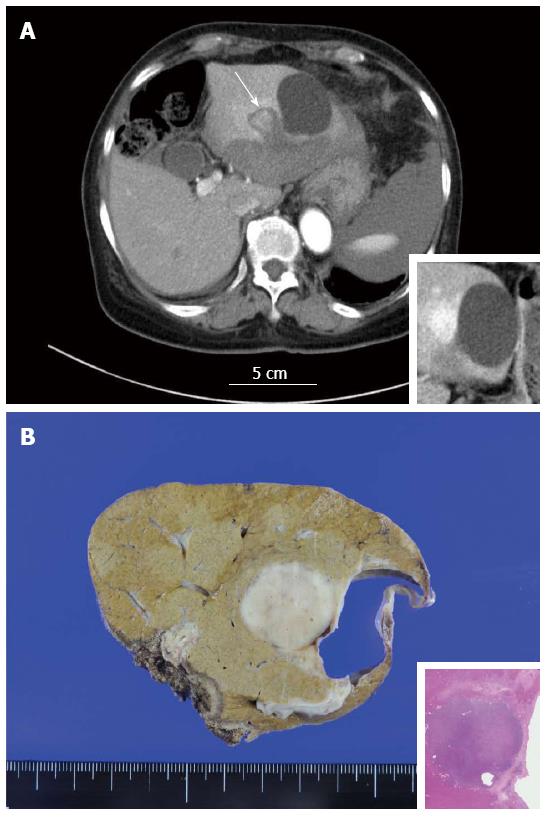
Figure 1 Computed tomography.
A: Contrast-enhanced abdominal CT on admission. Subcapsular hematoma at the left lobe of the liver and hemorrhagic ascites around the spleen were observed. The mass-like lesion measuring approximately 1.5 cm is also visible at segment 2 of the liver adjacent to the simple hepatic cyst (arrow). Inset: CT taken two months after onset. The nodule was highly enhanced by contrast medium in the early phase; B: The cut section of the nodule. A well-demarcated brown to whitish solid mass lesion measuring 2.5 cm in diameter was observed. A simple hepatic cyst was adjacent to the nodule. Inset: loupe image of the nodule (HE). CT: Computed tomography.
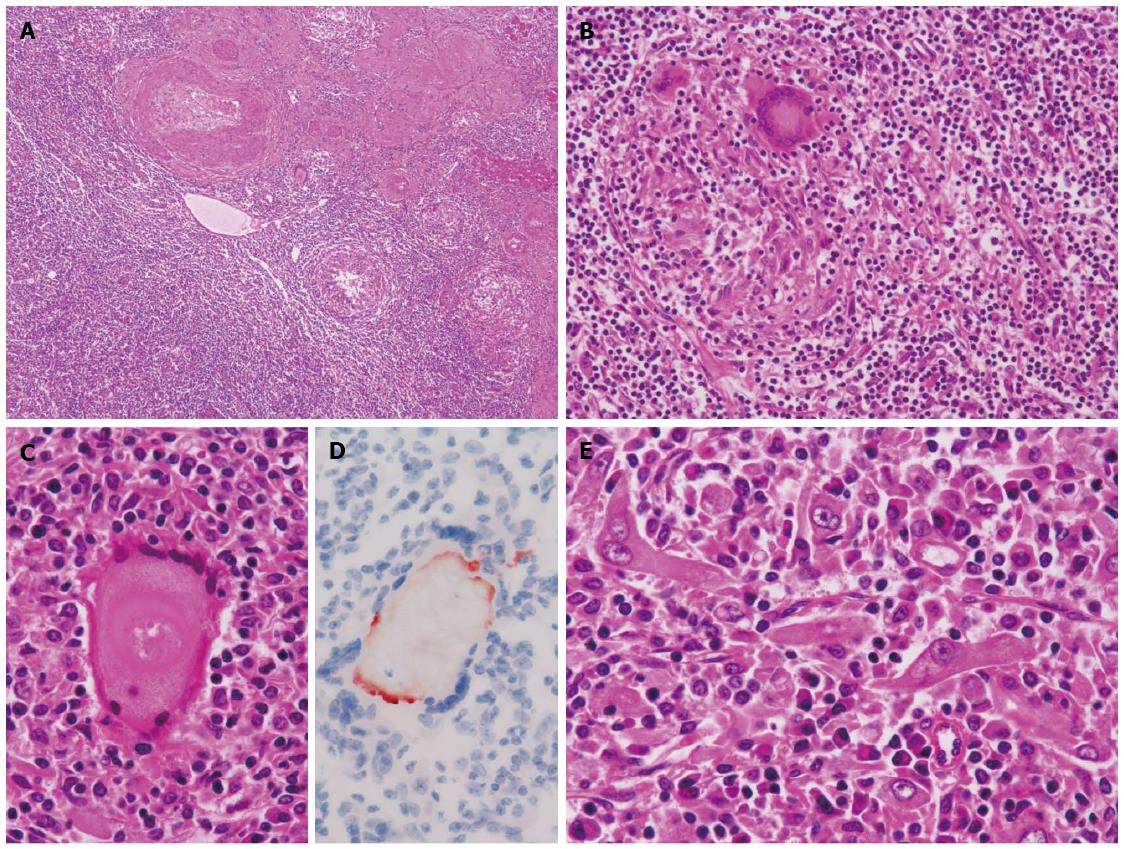
Figure 2 Histopathological features of the nodule.
A: The nodule contained numerous inflammatory cells. Thick-walled abnormal arteries were observed peripheral to and inside of the nodule [hematoxylin and eosin (HE), × 40]; B: Epithelioid granulomatous features were frequently observed in the nodule (HE, × 200); C: Some of the multinucleated giant cells contained amorphous material (HE, × 400); D: The amorphous material was positively stained by Oil Red O staining (Oil Red O staining, × 400); E: Among the infiltrating inflammatory cells, spindled, histiocytoid or myoid tumor cells with eosinophilic cytoplasm and oval-shaped atypical nuclei with distinct nucleoli were found (HE, × 400).
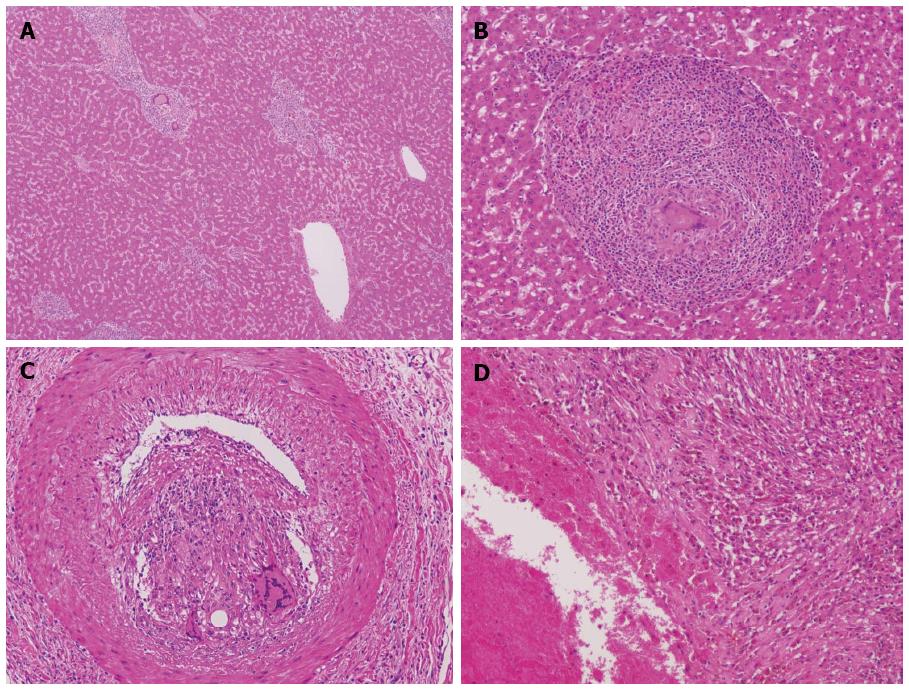
Figure 3 Histopathological features of the background liver.
A: Bridging fibrosis was not observed (HE, × 40); B: Many epithelioid granulomas were observed in portal tracts in the surrounding background liver (HE, × 100); C: Granulomas were also observed in the intima of some hepatic arteries (HE, × 100); D: Inflammatory granulation tissue containing hemosiderin-laden macrophages and old blood coagula which were consistent with a previous rupture and hemorrhage were observed adjacent to the nodule (HE, × 100).
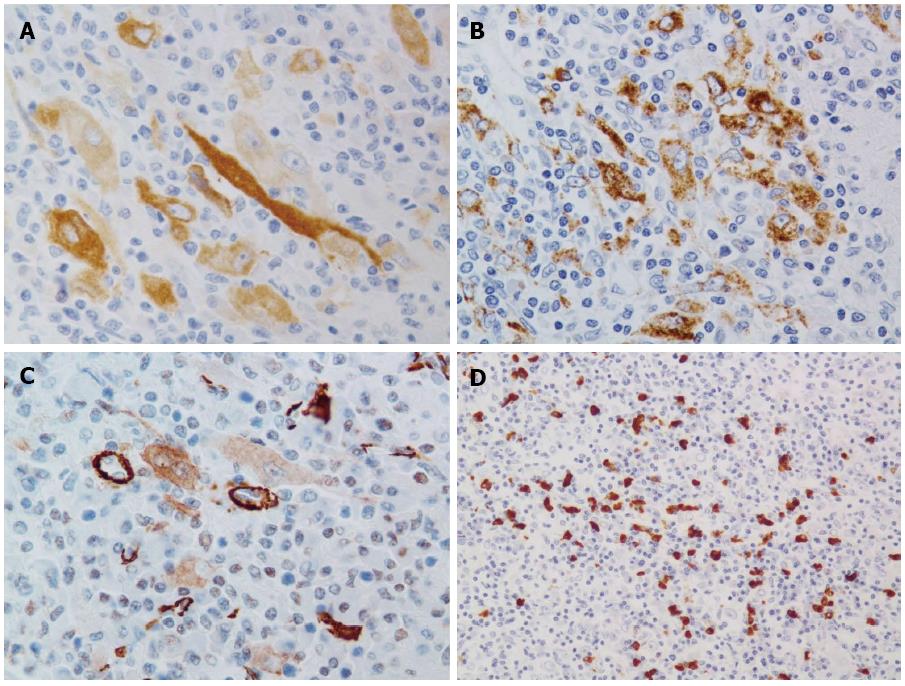
Figure 4 Findings of immunohistochemistry.
A: Immunohistochemistry for melan-A (× 400). The tumor cells diffusely expressed melan A; B: Immunohistochemistry for HMB45 (× 400). The tumor cells focally expressed HMB45; C: Few tumor cells weakly expressed alpha-SMA (× 400); D: Many IgG4-positive plasma cells were observed in the nodule (× 200).
- Citation: Kai K, Miyosh A, Aishima S, Wakiyama K, Nakashita S, Iwane S, Azama S, Irie H, Noshiro H. Granulomatous reaction in hepatic inflammatory angiomyolipoma after chemoembolization and spontaneous rupture. World J Gastroenterol 2015; 21(32): 9675-9682
- URL: https://www.wjgnet.com/1007-9327/full/v21/i32/9675.htm
- DOI: https://dx.doi.org/10.3748/wjg.v21.i32.9675


