Copyright
©The Author(s) 2015.
World J Gastroenterol. Aug 28, 2015; 21(32): 9666-9670
Published online Aug 28, 2015. doi: 10.3748/wjg.v21.i32.9666
Published online Aug 28, 2015. doi: 10.3748/wjg.v21.i32.9666
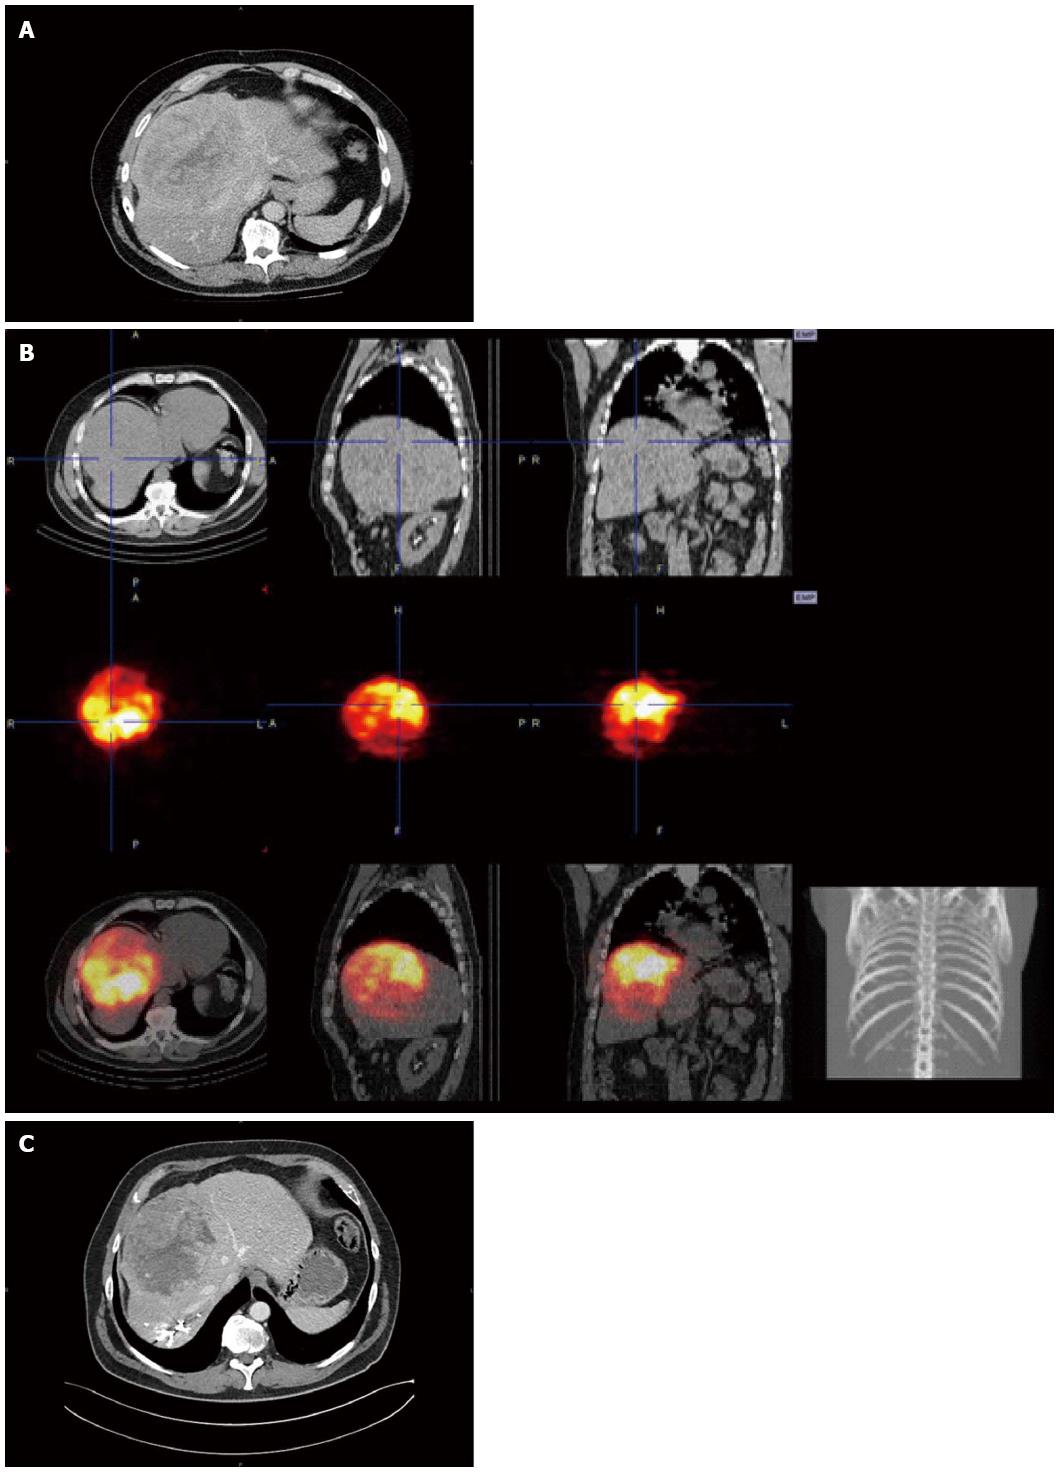
Figure 1 Tumor evolution throughout the therapeutic sequence.
A: Contrast-enhanced computed tomography (CT) scan at presentation showing, in portal phase, a 167 mm tumor in segment VIII with features of hepatocellular carcinoma; B: Yttrium-90 (90Y) positron emission tomography (PET)-CT performed 12 hours after transarterial radioembolization (TARE). Images are displayed in orthogonal views, centered on the liver tumor. Upper row: CT scan without contrast. Middle row: 90Y emission PET images showing high and selective accumulation of 90Y microspheres in the tumor site. Lower row: fused 90Y PET-CT images; C: Contrast-enhanced CT scan 17 wk after TARE and 6 wk after portal vein embolization showing, in portal phase, a 50% tumor volume reduction and hypertrophy of the future remnant left liver.
- Citation: Bouazza F, Poncelet A, Garcia CA, Delatte P, Engelhom JL, Galdon MG, Deleporte A, Hendlisz A, Vanderlinden B, Flamen P, Donckier V. Radioembolisation and portal vein embolization before resection of large hepatocellular carcinoma. World J Gastroenterol 2015; 21(32): 9666-9670
- URL: https://www.wjgnet.com/1007-9327/full/v21/i32/9666.htm
- DOI: https://dx.doi.org/10.3748/wjg.v21.i32.9666


