Copyright
©The Author(s) 2015.
World J Gastroenterol. Aug 28, 2015; 21(32): 9638-9647
Published online Aug 28, 2015. doi: 10.3748/wjg.v21.i32.9638
Published online Aug 28, 2015. doi: 10.3748/wjg.v21.i32.9638
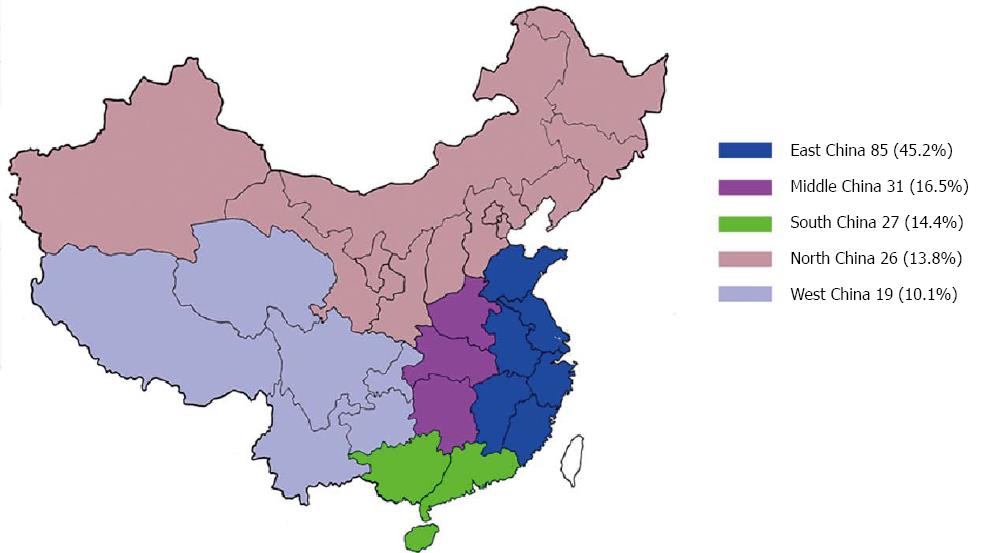
Figure 1 Geographical distribution of children with biliary atresia (n = 188).
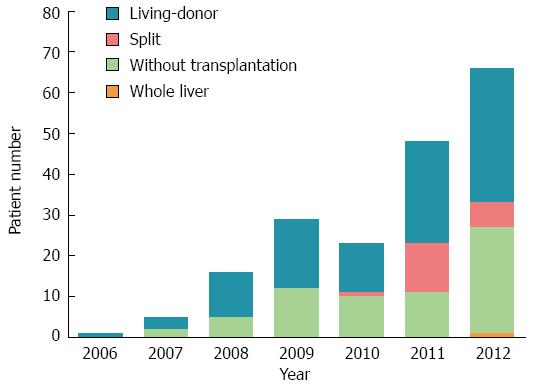
Figure 2 Caseload of children with biliary atresia from 2006 to 2012 (n = 188).
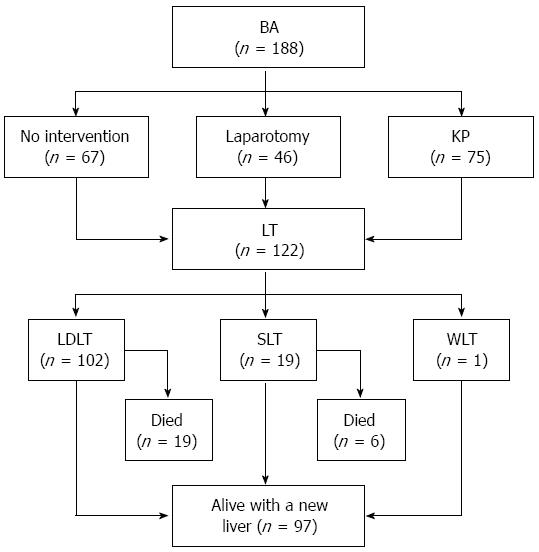
Figure 3 Flowchart providing outcomes of children with biliary atresia.
BA: Biliary atresia; KP: Kasai procedure; LDLT: Living donor liver transplantation; LT: Liver transplantation; SLT: Split liver transplantation; WLT: Whole liver transplantation.
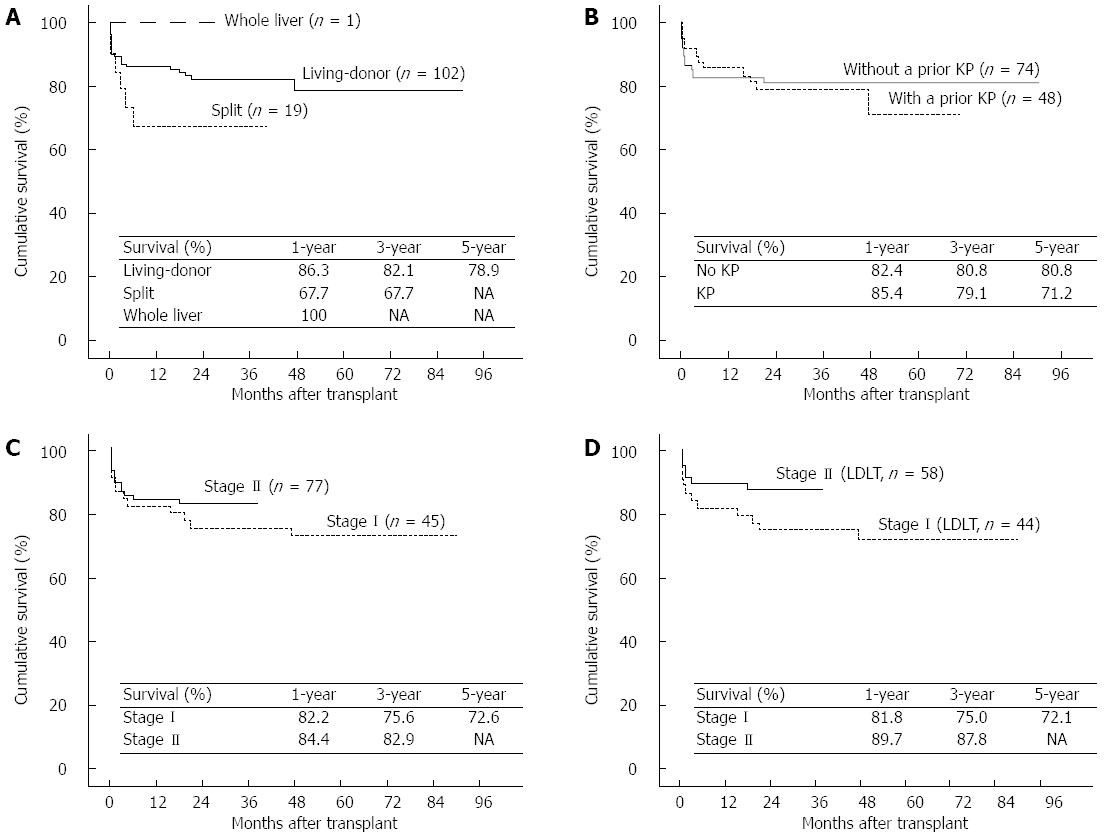
Figure 4 Patient and graft survival after liver transplantation for biliary atresia (n = 122).
A: Comparison between patients using different donor types (P = 0.286); B: Comparison between patients with or without a prior Kasai procedure (KP) (P = 0.701); C: Comparison between patients in stages I and II (P = 0.358); D: Comparison between the two stages within the living donor liver transplantation (LDLT) group (P = 0.107). NA: Not available.
- Citation: Li QG, Wan P, Zhang JJ, Chen QM, Chen XS, Han LZ, Xia Q. Liver transplantation for biliary atresia: A single-center study from mainland China. World J Gastroenterol 2015; 21(32): 9638-9647
- URL: https://www.wjgnet.com/1007-9327/full/v21/i32/9638.htm
- DOI: https://dx.doi.org/10.3748/wjg.v21.i32.9638


