Copyright
©The Author(s) 2015.
World J Gastroenterol. Aug 14, 2015; 21(30): 9079-9092
Published online Aug 14, 2015. doi: 10.3748/wjg.v21.i30.9079
Published online Aug 14, 2015. doi: 10.3748/wjg.v21.i30.9079
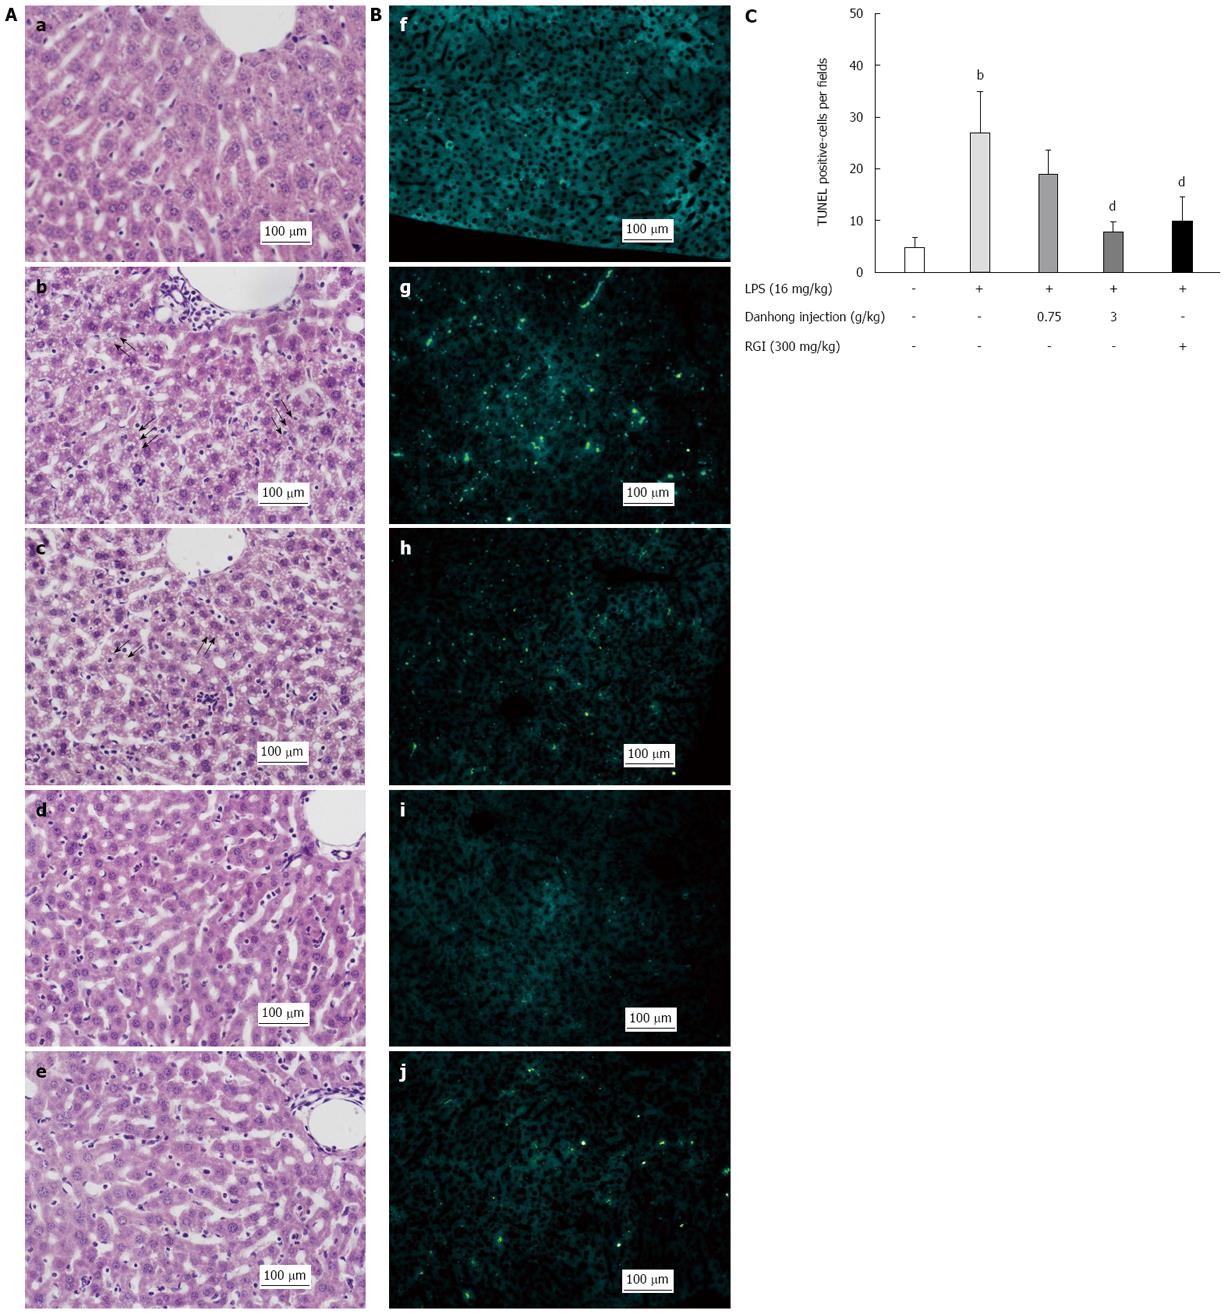
Figure 1 Effects of Danhong injection on hepatic histopathology and apoptosis.
A: Hematoxylin-eosin staining (magnification × 200); B: TUNEL assay (magnification × 200), (a/f) Blank control group, (b/g) Lipopolysaccharide (LPS)-stimulated group, (c/h) Danhong injection (DHI) (0.75 g/kg) + LPS-stimulated group, (d/i) DHI (3 g/kg) + LPS-stimulated group, and (e/j) RGI (300 mg/kg) + LPS-stimulated group; C: Analysis of apoptotic cell numbers. The number of apoptotic cells per field (1 mm2) was determined using NIH Image J software (n = 6). bP < 0.01 vs blank control group, dP < 0.01 vs LPS-treated group. Arrows indicate fat degeneration.
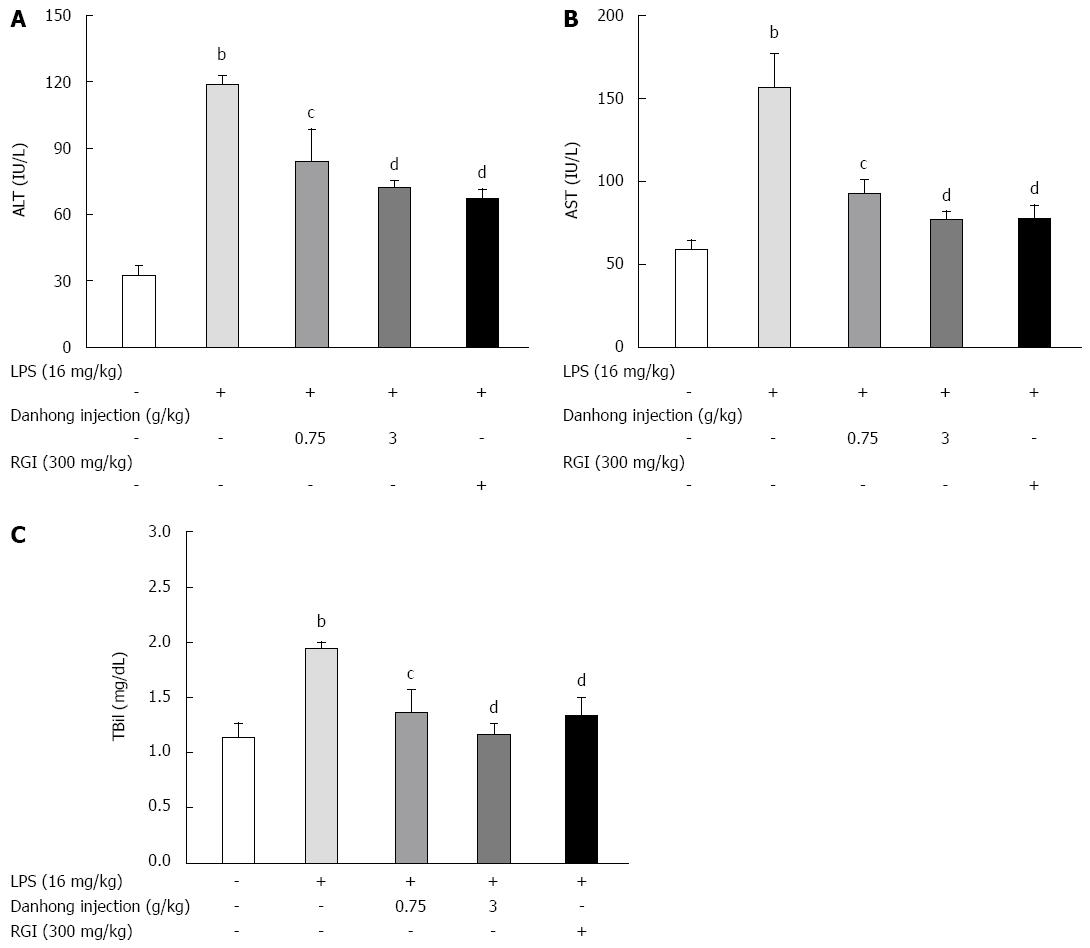
Figure 2 Effects of Danhong injection on serum alanine transferase and aspartate transaminase activities and total bilirubin production in lipopolysaccharide-treated mice.
Different groups of mice were pre-treated with glutathione for injection (RGI) or 0.9% saline for 30 min before lipopolysaccharide (LPS) or 0.9% saline injection for 6 h. Values are mean ± SE (n = 8). bP < 0.01 vs blank control group, cP < 0.05, dP < 0.01 vs LPS-treated group.
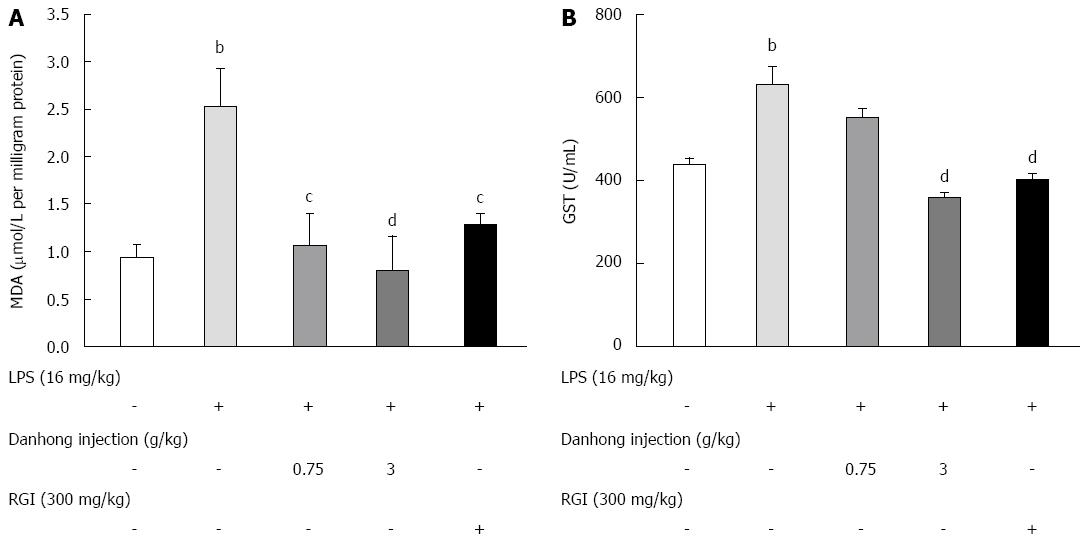
Figure 3 Effects of Danhong injection on malondialdehyde production and glutathione-S-transferase activity in liver homogenates of lipopolysaccharide-induced mice.
Mice were pre-treated with Danhong injection (DHI), glutathione for injection (RGI) or 0.9% saline for 30 min before lipopolysaccharide (LPS) or 0.9% saline injection for 6 h. Values are mean ± SE (n = 8). bP < 0.01 vs blank control group, cP < 0.05, dP < 0.01 vs LPS-treated group.
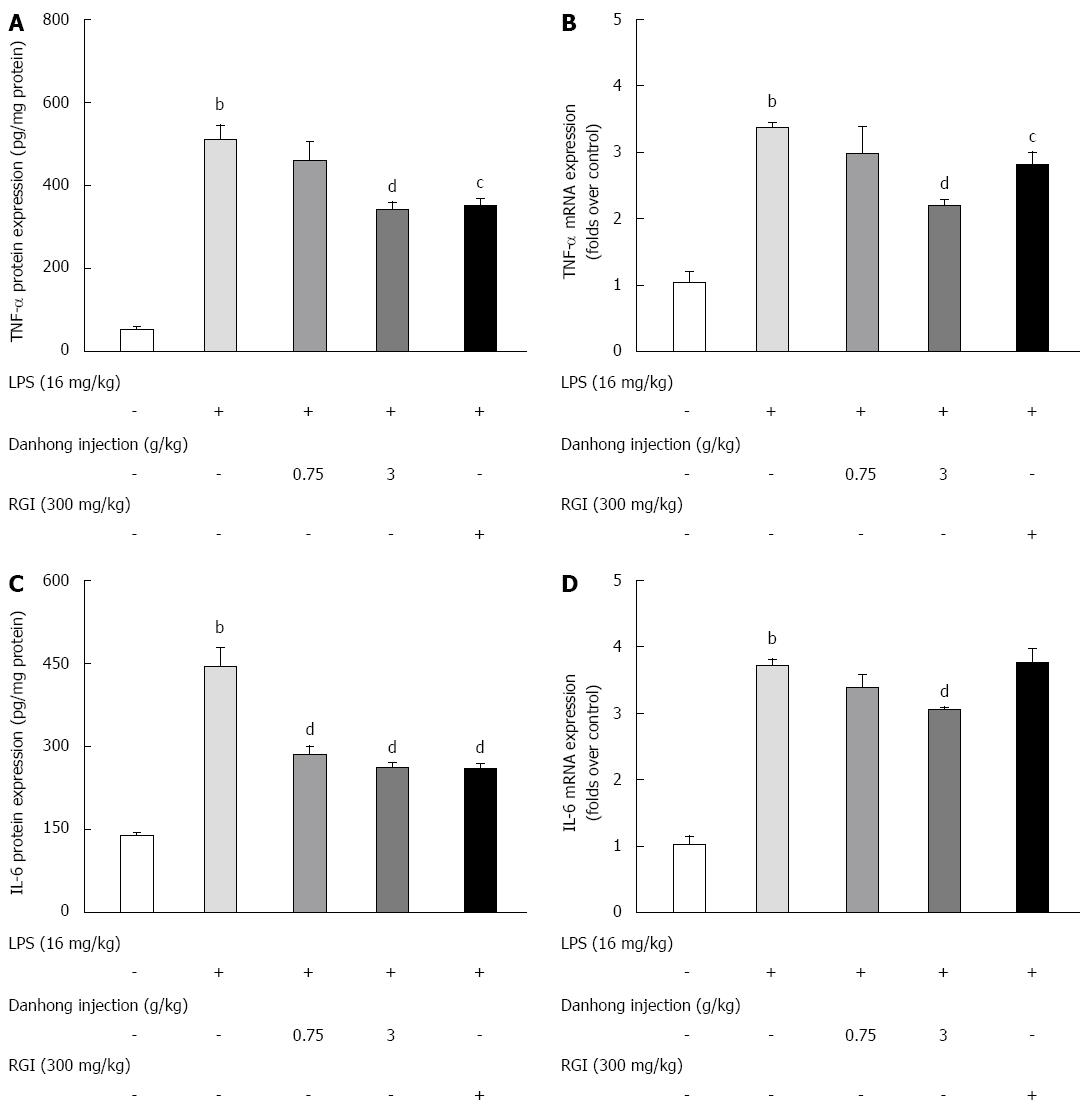
Figure 4 Effects of Danhong injection on tumour necrosis factor-α and interleukin-6 expression in mouse liver.
The protein expression levels of tumour necrosis factor (TNF)-α (A) and interleukin (IL)-6 (C) were measured by ELISA. Values are mean ± SE (n = 8). TNF-α (B) and IL-6 (D) mRNA expression was detected by real-time RT-PCR. Values are mean ± SE (n = 3) of three independent experiments. bP < 0.01 vs blank control group, cP < 0.05, dP < 0.01 vs lipopolysaccharide (LPS)-treated group.
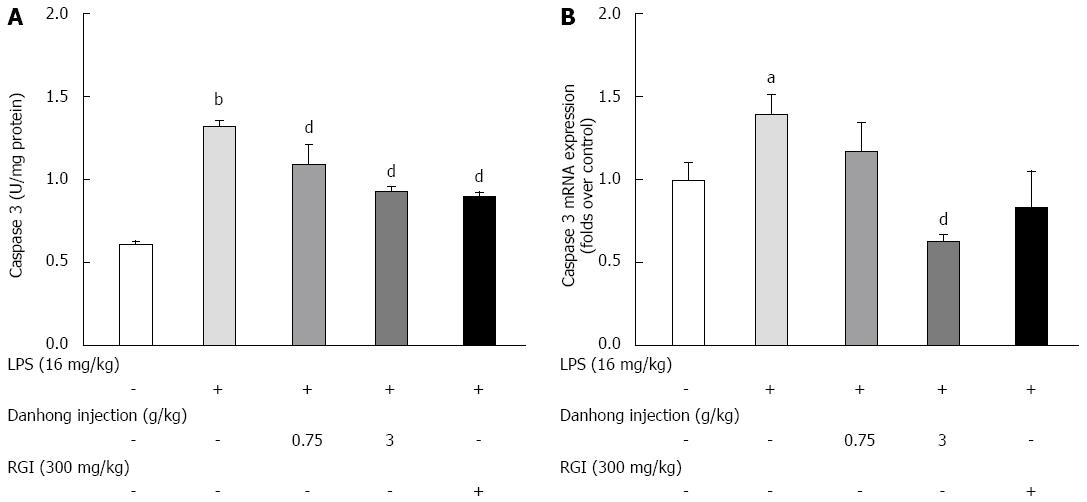
Figure 5 Effects of Danhong injection on liver caspase-3 activity.
A: Caspase-3 enzymatic activity was measured using a modified commercial kit. Values are mean ± SE (n = 8); B: Caspase-3 mRNA expression was detected by real-time reverse transcription-polymerase chain reaction. Values are mean ± SE (n = 3) of three independent experiments. bP < 0.05, dP < 0.01 vs blank control group, dP < 0.01 vs lipopolysaccharide (LPS)-treated group.
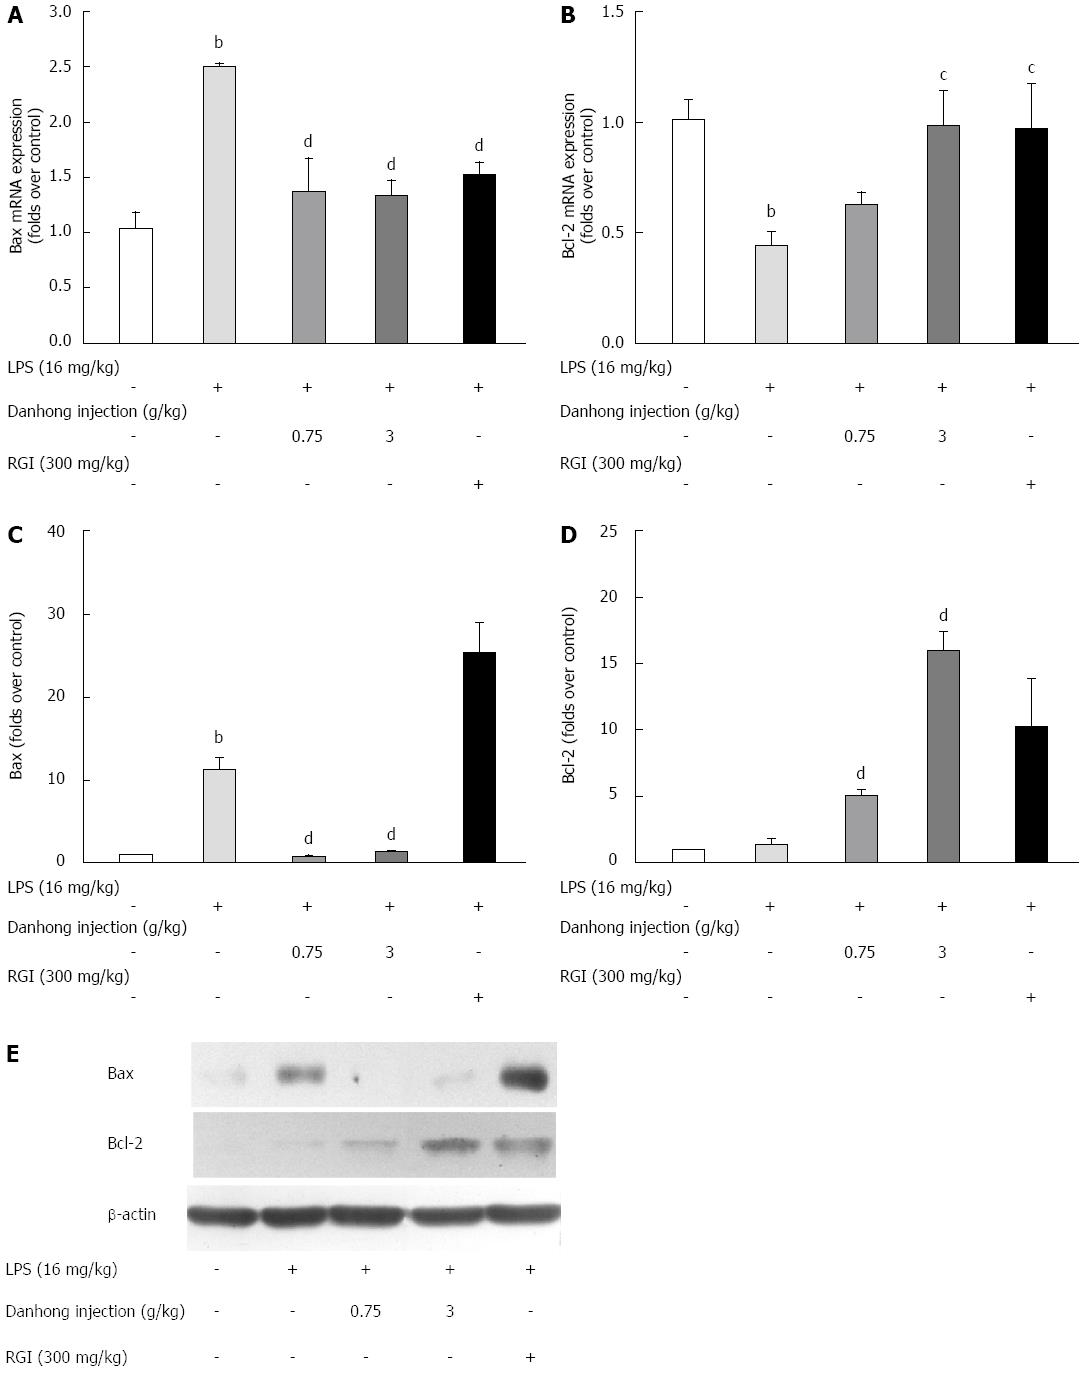
Figure 6 Effects of Danhong injection on liver Bcl-2 and Bax expression.
The mRNA expression of Bax (A) and Bcl-2 (B) was detected by real-time RT-PCR. Values are mean ± SE (n = 3) of three independent experiments. Bcl-2 and Bax protein expression was detected by Western blot (E). The relative optical density is shown (C and D). bP < 0.01 vs blank control group, cP < 0.05, dP < 0.01 vs lipopolysaccharide (LPS)-treated group. β-actin was used as an internal control.
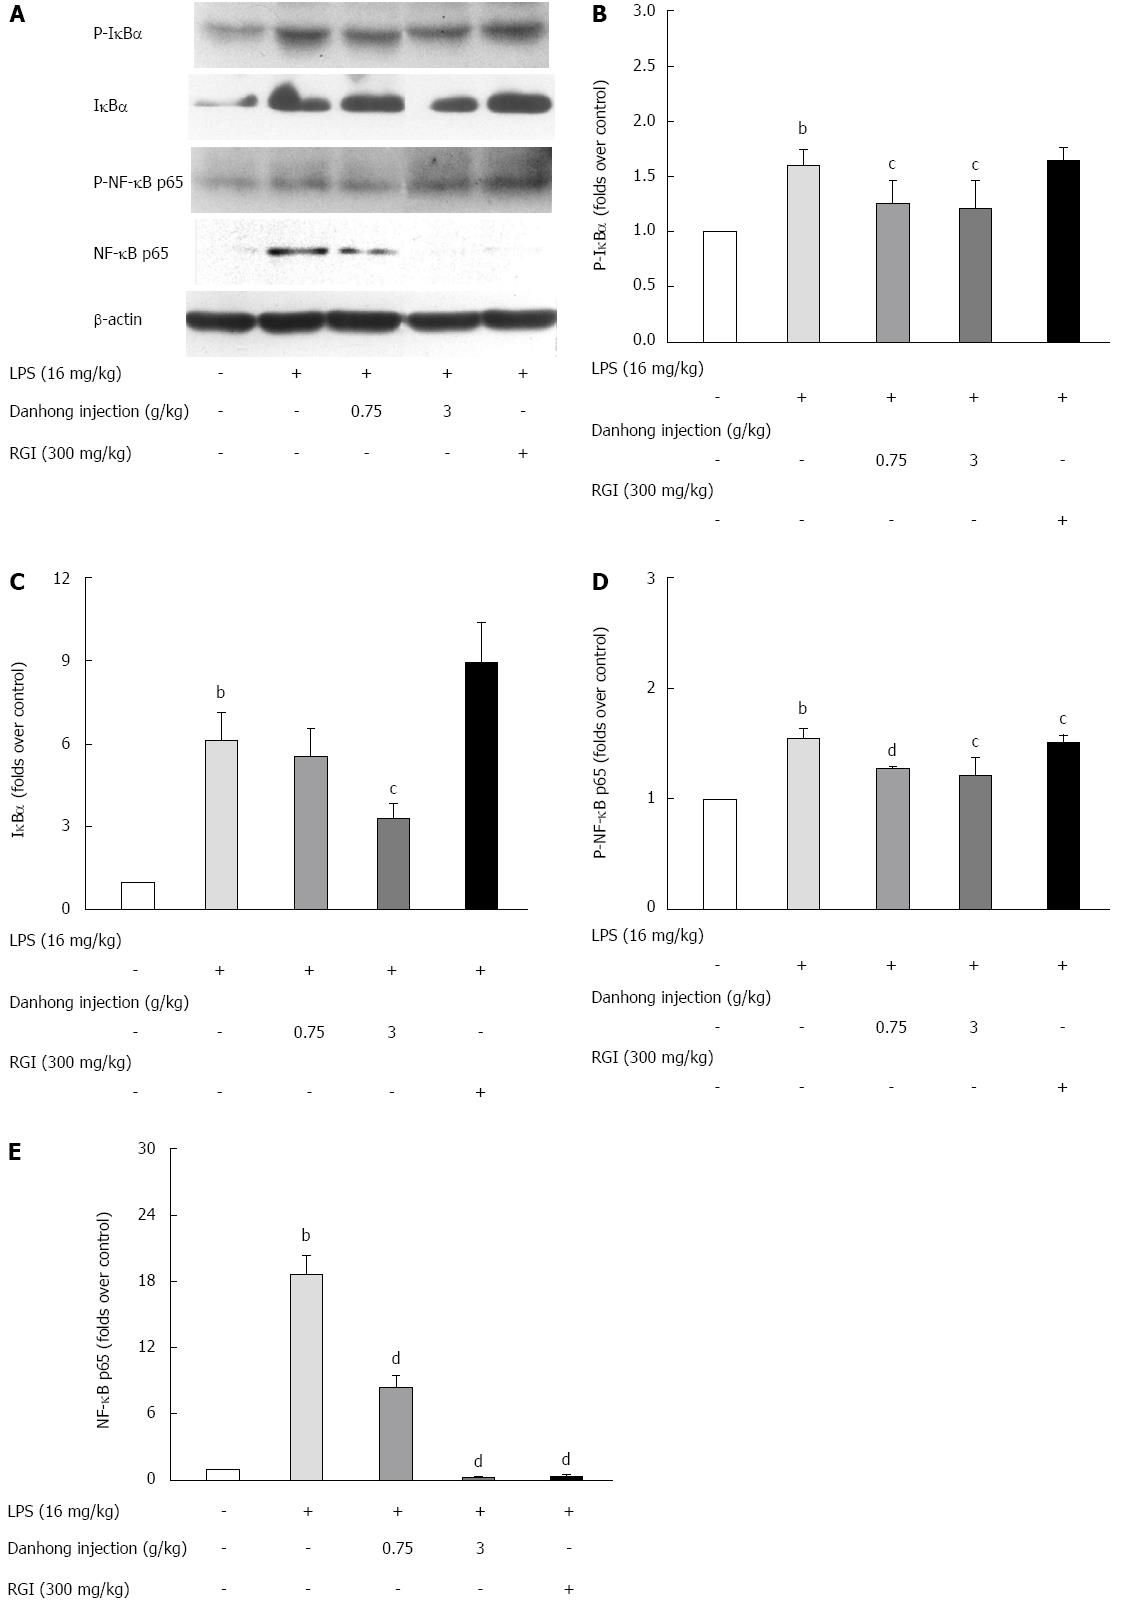
Figure 7 Effects of Danhong injection on liver nuclear factor-κB family protein expression.
Phospho-IκB-α, IκBα, phospho-NF-κB p65 and NF-κB p65 protein expression in the mouse liver was examined by Western blot (A). The relative optical density is shown (B-E). bP < 0.01 vs blank control group, cP < 0.05, dP < 0.01 vs lipopolysaccharide (LPS)-treated group. β-actin was used as an internal control.
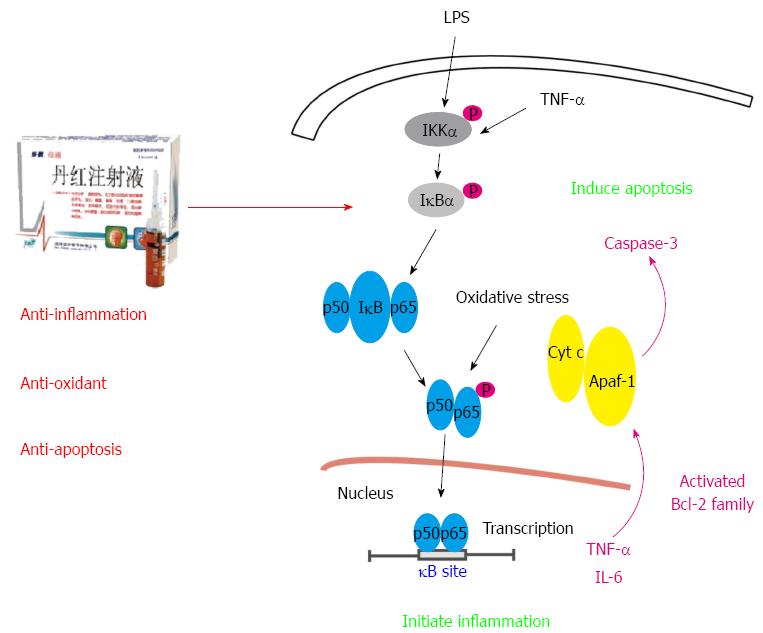
Figure 8 Pharmacological mechanism of Danhong injection on lipopolysaccharide-induced acute liver injury.
Danhong injection (DHI) protected against lipopolysaccharide (LPS)-induced acute liver injury by regulating IκBα, and nuclear factor (NF)-κB p65 phosphorylation as well as NF-κB p65 translocation from the cytoplasm to the nucleus. Subsequently, TNF-α and IL-6 secretion, Bax and Bcl-2 expression, and caspase-3 activity were modified and balanced.
-
Citation: Gao LN, Yan K, Cui YL, Fan GW, Wang YF. Protective effect of
Salvia miltiorrhiza andCarthamus tinctorius extract against lipopolysaccharide-induced liver injury. World J Gastroenterol 2015; 21(30): 9079-9092 - URL: https://www.wjgnet.com/1007-9327/full/v21/i30/9079.htm
- DOI: https://dx.doi.org/10.3748/wjg.v21.i30.9079


