Copyright
©The Author(s) 2015.
World J Gastroenterol. Aug 7, 2015; 21(29): 8858-8867
Published online Aug 7, 2015. doi: 10.3748/wjg.v21.i29.8858
Published online Aug 7, 2015. doi: 10.3748/wjg.v21.i29.8858
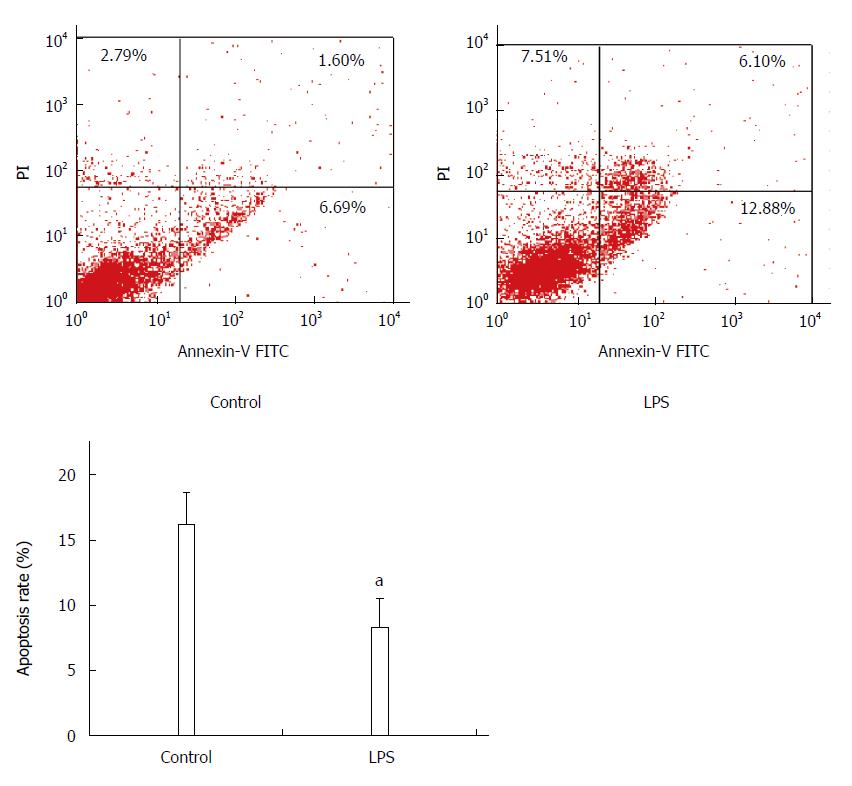
Figure 1 Protective effect of lipopolysaccharide on apoptosis of hepatic stellate cell-T6 cells.
Cells were treated with 1 μg/mL LPS for 48 h. Upper panel, flow cytometry according to annexin-fluorescein isothiocyanate/PI double staining; lower panel, apoptosis rate. Data are expressed as mean ± SD. n = 3, aP < 0.05 (P = 0.013) vs control. LPS: lipopolysaccharide.
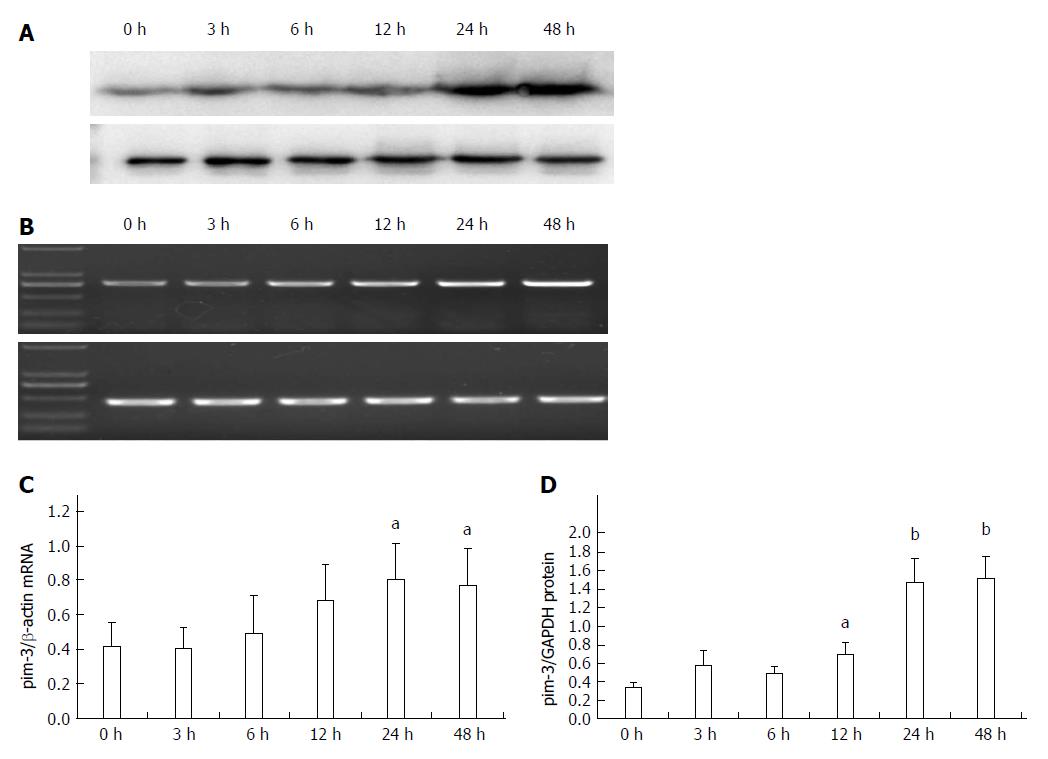
Figure 2 Overexpression of pim-3 in lipopolysaccharide-stimulated hepatic stellate cells-T6 cells.
Cells were treated at different times, with 1 μg/mL lipopolysaccharide for 0, 3, 6, 12, 24 and 48 h, and samples were collected at the same final time of 48 h. mRNA and protein level of pim-3 expression was detected by RT-PCR and Western blotting, respectively. A: Representative mRNA expression; B: Representative protein expression; C: Relative level of pim-3 was normalized to value obtained for β-actin mRNA expression; D: Relative level of pim-3 was normalized to value obtained for GADPH protein expression. The data are expressed in line chart in order to reflect the expression change over time. Data are expressed as mean ± SD (n = 3). aP < 0.05 vs 0 h; bP < 0.01 vs 0 h.
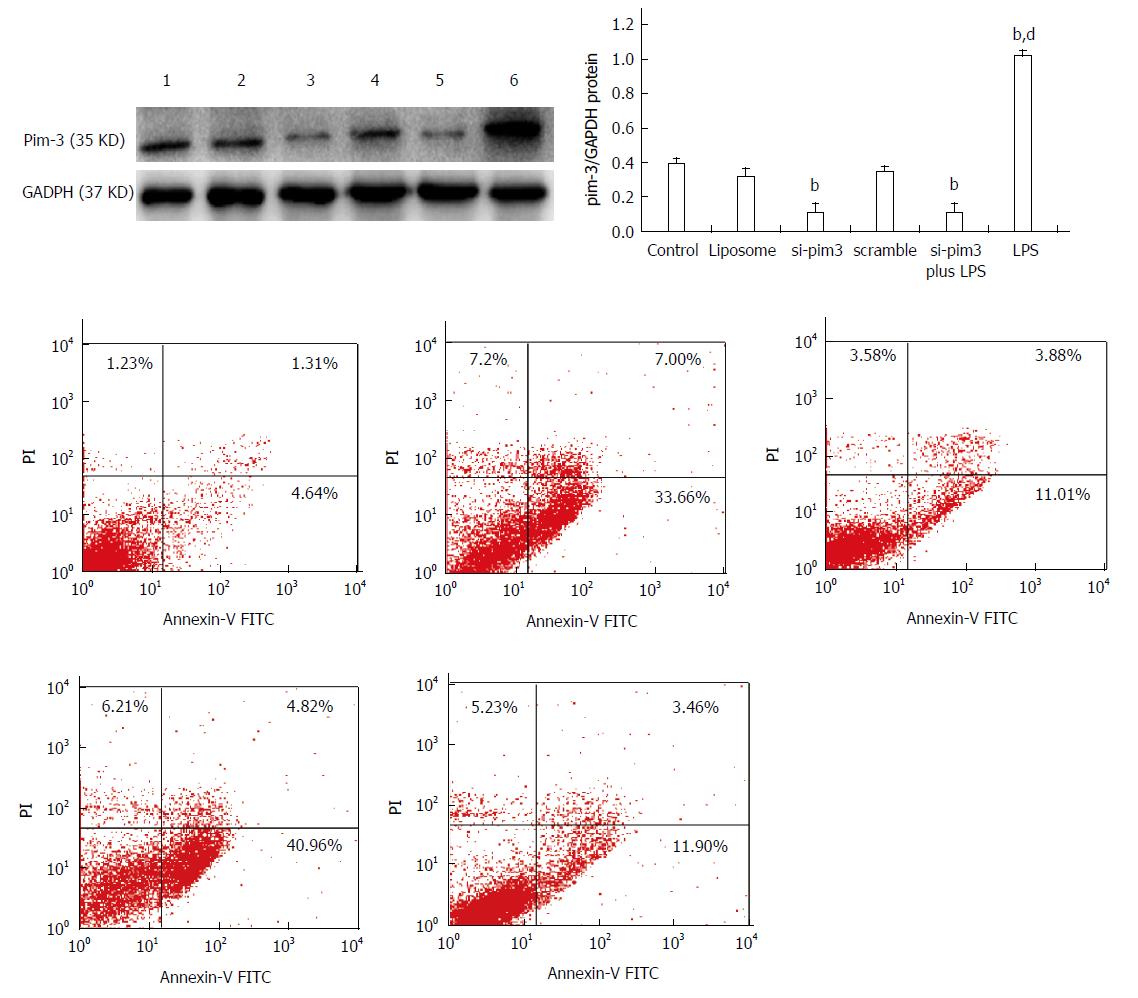
Figure 3 Effect of si-pim3 on pim-3 expression.
Cells were treated at different times and pim-3 protein was detected at 48 h by western blotting. Lane 1: control; Lane 2: liposomes; Lane 3: si-pim3; Lane 4: scrambled; Lane 5: si-pim3 plus LPS; Lane 6: LPS. Upper panel, representative Western blotting results; lower panel, relative expression levels of proteins, normalized against GADPH. Data are expressed as mean ± SD (n = 3 ). bP < 0.01 vs control, dP < 0.01 LPS vs other groups.
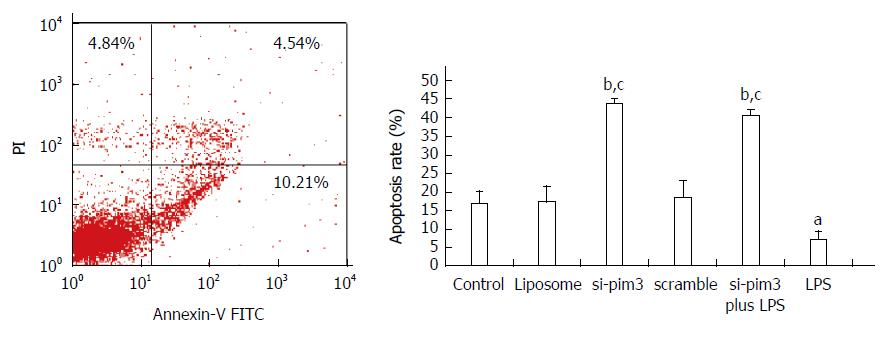
Figure 4 Effect of ablation of pim-3 on hepatic stellate cells-T6 cell apoptosis.
Cells were treated with si-pim3, LPS or si-pim3 plus LPS for 48 h, and apoptosis was detected by flow cytometry followed by annexin V-FITC/PI double staining. A: Representative flow cytometry following Annexin V-FITC and PI staining; B: Data are expressed in a histogram in order to reflect the apoptosis change among the six groups. Data are expressed as mean ± SD. n = 3, aP < 0.05 LPS vs control; bP < 0.01 versus control; cP < 0.01 vs LPS group.
- Citation: Liu LH, Lai QN, Chen JY, Zhang JX, Cheng B. Overexpression of pim-3 and protective role in lipopolysaccharide-stimulated hepatic stellate cells. World J Gastroenterol 2015; 21(29): 8858-8867
- URL: https://www.wjgnet.com/1007-9327/full/v21/i29/8858.htm
- DOI: https://dx.doi.org/10.3748/wjg.v21.i29.8858


