Copyright
©The Author(s) 2015.
World J Gastroenterol. Aug 7, 2015; 21(29): 8817-8825
Published online Aug 7, 2015. doi: 10.3748/wjg.v21.i29.8817
Published online Aug 7, 2015. doi: 10.3748/wjg.v21.i29.8817
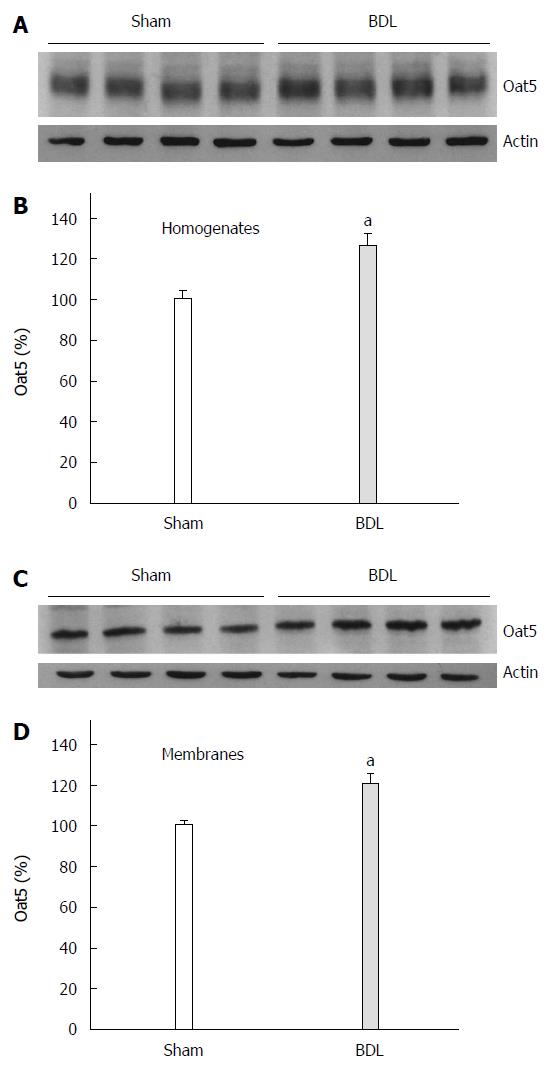
Figure 1 Oat5 protein expression in homogenates.
Renal homogenates (20 μg proteins) (A) and brush border membranes (10 μg proteins) (C) from kidneys of Sham and BDL rats were separated by sodium dodecyl sulphate-polyacrylamide gel electrophoresis (8.5%) and blotted onto nitrocellulose membranes. Oat5 was identified using a non-commercial polyclonal antibody as described in Materials and Methods. Densitometric quantification of Oat5 (B and D). Sham levels were set at 100%. Each column represents mean ± SE from experiments carried out in triplicate on four different homogenates and brush border membranes preparations for each experimental group, aP < 0.05 vs Sham.
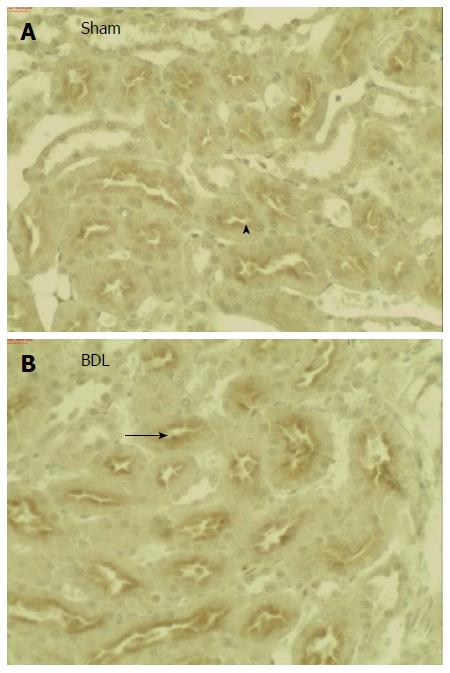
Figure 2 Immunohistochemistry for Oat5 in kidneys from Sham (A) and BDL (B) rats.
Serial sections from each rat kidney were stained using a non-commercial anti-Oat5 antibody. Oat5 labeling was associated with the apical plasma membrane domains in proximal tubule cells (arrow heads). In kidneys from BDL group there was a marked increase in Oat5 staining (arrows). These figures are representative of typical samples from four rats for each experimental group. Magnification × 200.
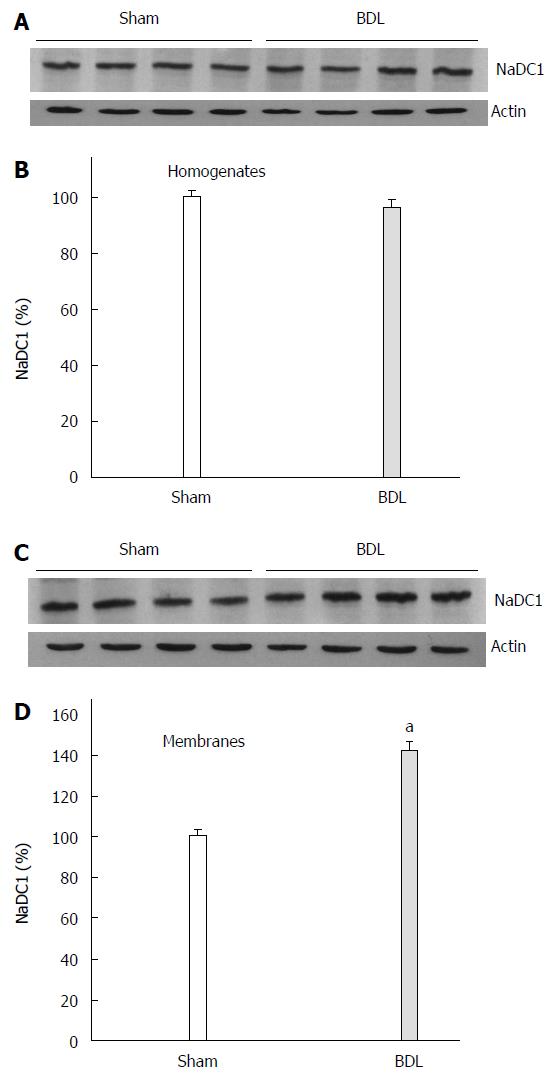
Figure 3 NaDC1 protein expression in homogenates.
Renal homogenates (20 μg proteins) (A) and brush border membranes (10 μg proteins) (C) from kidneys of Sham and BDL rats were separated by sodium dodecyl sulphate-polyacrylamide gel electrophoresis (8.5%) and blotted onto nitrocellulose membranes. NaDC1 was identified using a non-commercial polyclonal antibody as described in Materials and Methods. Densitometric quantification of NaDC1 (B and D). Sham levels were set at 100%. Each column represents mean ± SE from experiments carried out in triplicate on four different homogenates and brush border membranes preparations for each experimental group, aP < 0.05 vs Sham.
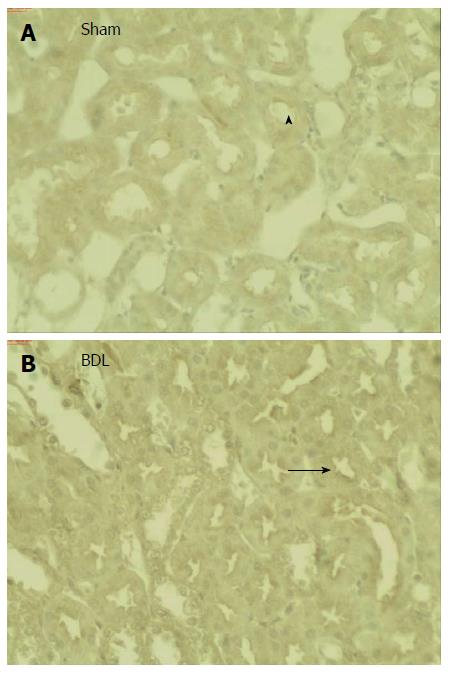
Figure 4 Immunohistochemistry for NaDC1 in kidneys from Sham (A) and BDL (B) rats.
Serial sections from each rat kidney were stained using a non-commercial anti-NaDC1 antibody. NaDC1 labelling was associated with the apical plasma membrane domains in proximal tubule cells (arrow heads). In kidneys from BDL group there was a marked increase in NaDC1 staining (arrows). These figures are representative of typical samples from four rats for each experimental group, magnification × 200.
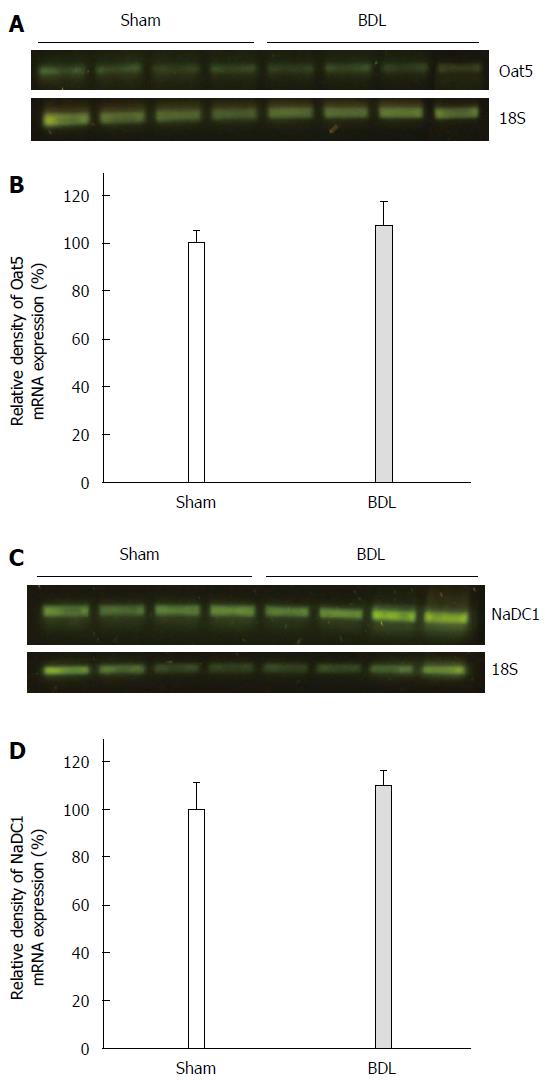
Figure 5 Expression of Oat5 (A, B) and NaDC1 (C, D) mRNA in the kidney from Sham and BDL rats.
Data are presented as percentage considering the mean Sham value as 100%. Results are expressed as mean ± SE of four rats per group. The 18S mRNA was used as internal control.
- Citation: Brandoni A, Torres AM. Expression of renal Oat5 and NaDC1 transporters in rats with acute biliary obstruction. World J Gastroenterol 2015; 21(29): 8817-8825
- URL: https://www.wjgnet.com/1007-9327/full/v21/i29/8817.htm
- DOI: https://dx.doi.org/10.3748/wjg.v21.i29.8817


