Copyright
©The Author(s) 2015.
World J Gastroenterol. Aug 7, 2015; 21(29): 8787-8803
Published online Aug 7, 2015. doi: 10.3748/wjg.v21.i29.8787
Published online Aug 7, 2015. doi: 10.3748/wjg.v21.i29.8787
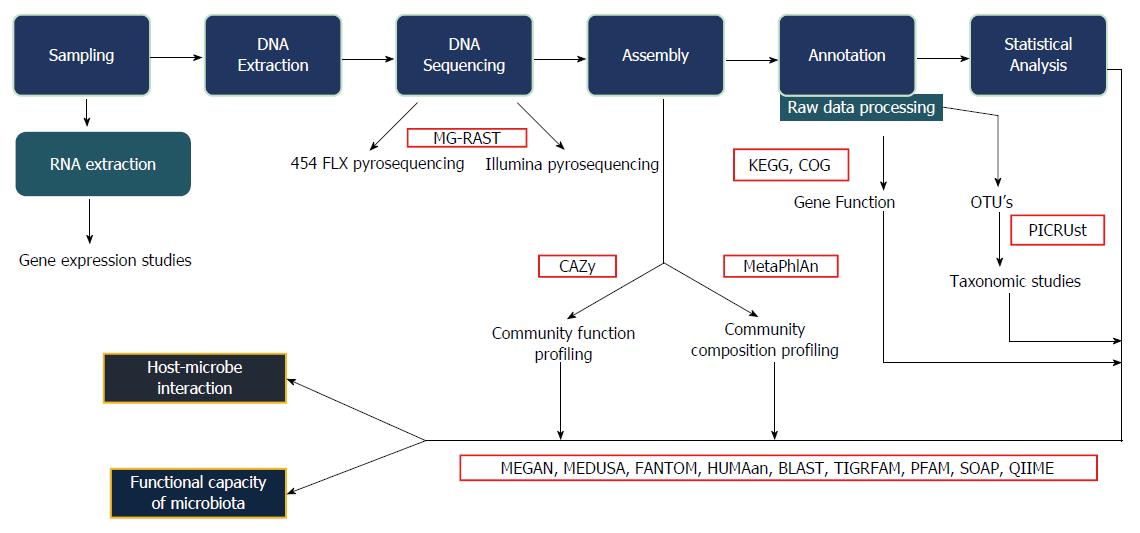
Figure 1 Bioinformatics work flow.
This figure explains the various steps involved in the bioinformatics analysis, starting from collection of samples, extraction, sequencing and statistical analysis. The interaction between host and microbes along with the functional capacity of the microbiota can be studied. MG-RAST: Metagenomics rapid annotation using subsystem technology; CAZy: Carbohydrate active-enzymes; MetaPhlAn: Metagenomic phylogenetic analysis; KEGG: Kyoto encyclopaedia for genes and genomics; COG: Clusters of orthologous group; PICRUst: Phylogenetic investigation of communities by reconstruction of unobserved states; MEGAN: Meta genome analyzer; MEDUSA: Metagenomic data utilization and analysis; FANTOM: Functional annotation and taxonomic analysis of metagenomes; HUMAan: Human microbiome project unified metabolic analysis network; BLAST: Basic local alignment search tool; TIGRFAM: Protein sequence classification; PFAM: Protein families; SOAP: Short oligonucleotide analysis package; QIIME: Quantitative insights into microbial ecology.
Figure 2 Distribution of the normal human gut flora.
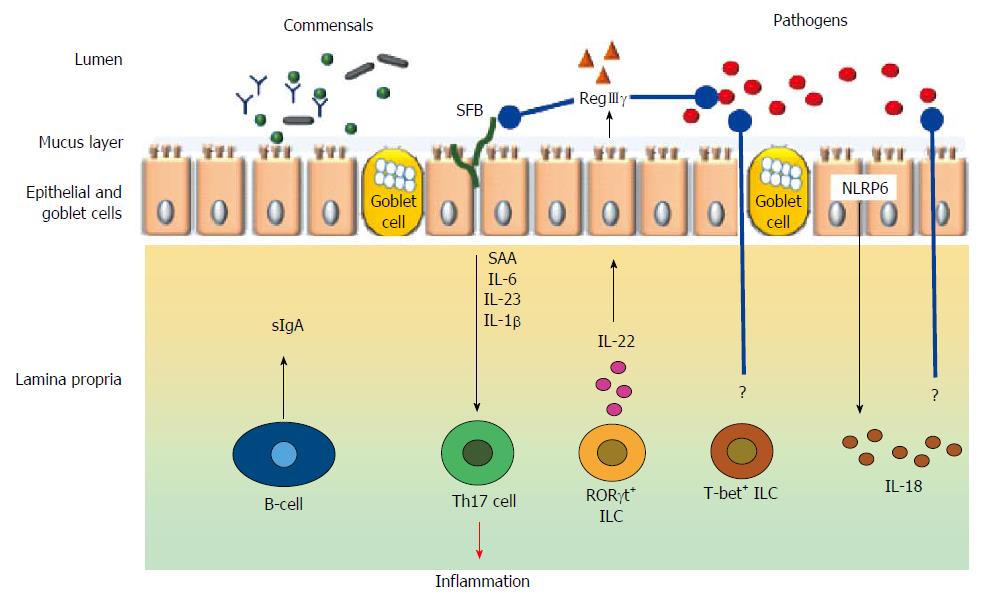
Figure 3 Broad schematic representation of cell types and mediators involved in immunomodulation in the gut.
Black arrow indicate either physiological secretion or activation; Red arrow indicates pathological event; Blue arrows with rounded ends indicates pathogen inhibition; ? indicates unknown mechanisms; SFB indicates short filamentous bacteria.
- Citation: Jandhyala SM, Talukdar R, Subramanyam C, Vuyyuru H, Sasikala M, Reddy DN. Role of the normal gut microbiota. World J Gastroenterol 2015; 21(29): 8787-8803
- URL: https://www.wjgnet.com/1007-9327/full/v21/i29/8787.htm
- DOI: https://dx.doi.org/10.3748/wjg.v21.i29.8787


