Copyright
©The Author(s) 2015.
World J Gastroenterol. Jul 14, 2015; 21(26): 8043-8051
Published online Jul 14, 2015. doi: 10.3748/wjg.v21.i26.8043
Published online Jul 14, 2015. doi: 10.3748/wjg.v21.i26.8043
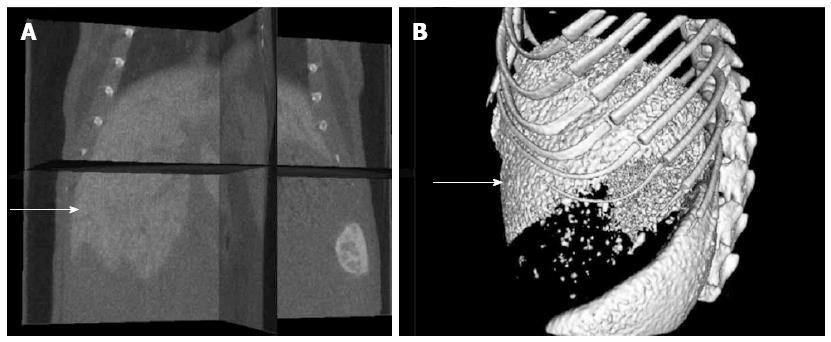
Figure 1 Contrast enhanced computed tomography images of a normal liver.
A: 3D image of a liver (arrow); B: Perspective view of a liver (arrow).
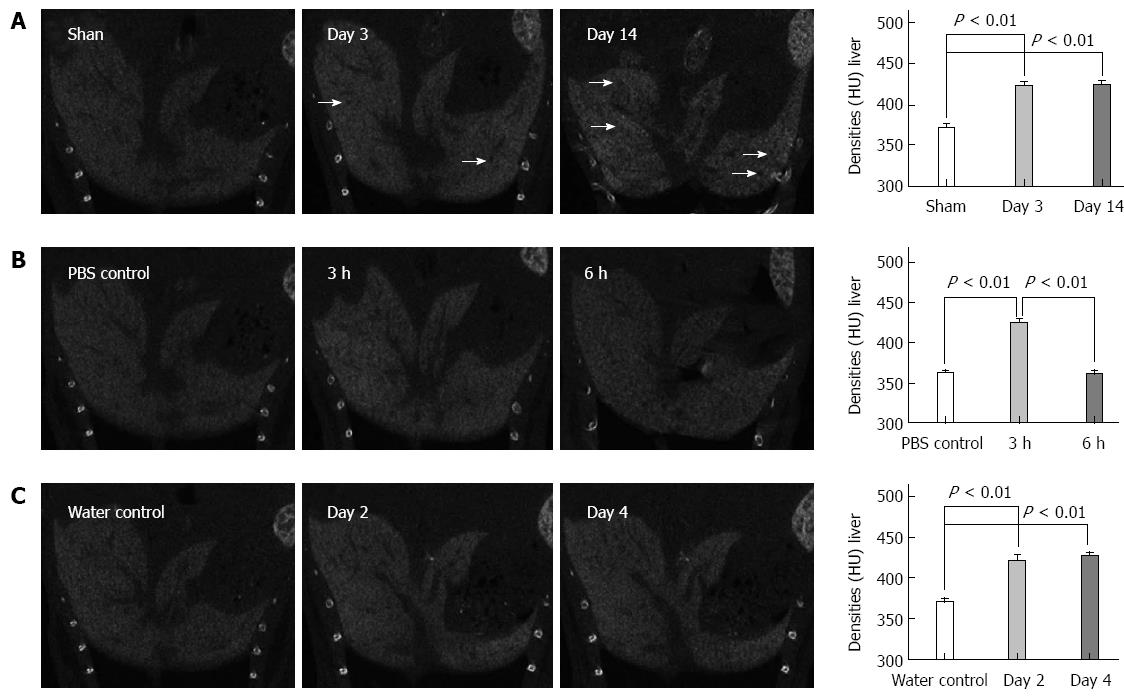
Figure 2 Contrast-enhanced computed tomography images of liver lesions induced by bile duct ligation (A), lipopolysaccharide/D-GalN (B) and alcohol (C); density measured in the livers are reported as HU.
The black arrows indicate black regions with low densities. Values are represented as the means of triplicate values and presented as the mean ± SD.
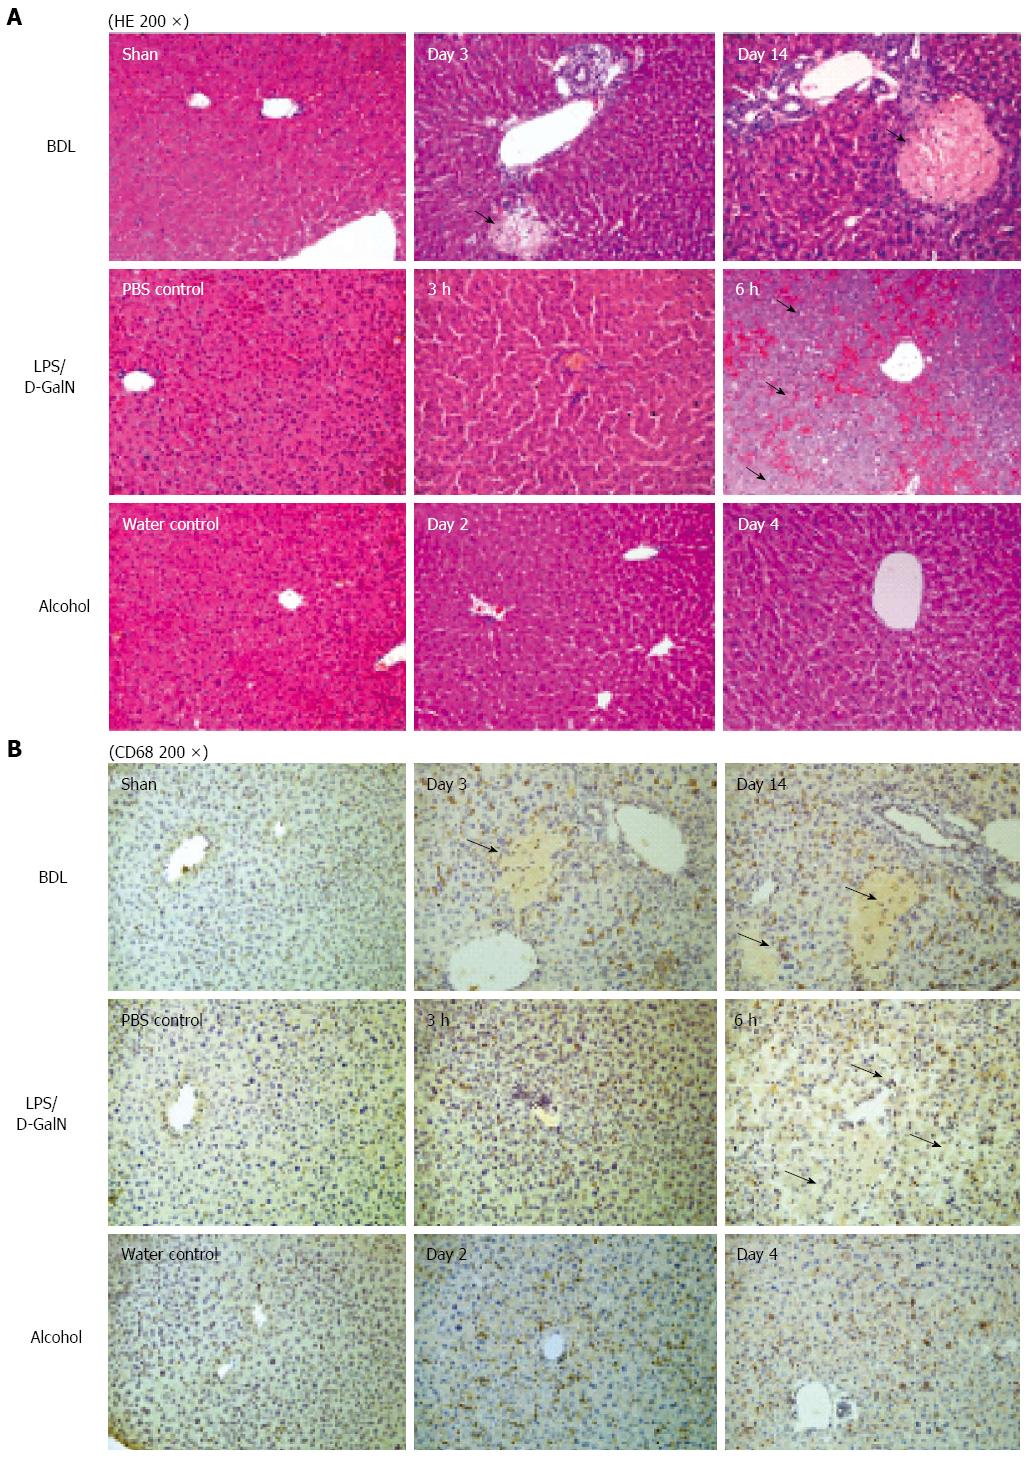
Figure 3 HE stains for liver lesions induced by bile duct ligation, lipopolysaccharide/D-GalN and alcohol (A); Immunostaining of CD68 after liver lesions induced by bile duct ligation, lipopolysaccharide/D-GalN or alcohol (B).
The black arrows indicate necrosis, and the white arrows indicate dilated biliary tracts.
Figure 4 ALT levels in mouse models induced by bile duct ligation (A), lipopolysaccharide/D-GalN (B) and alcohol (C), bP < 0.
01.
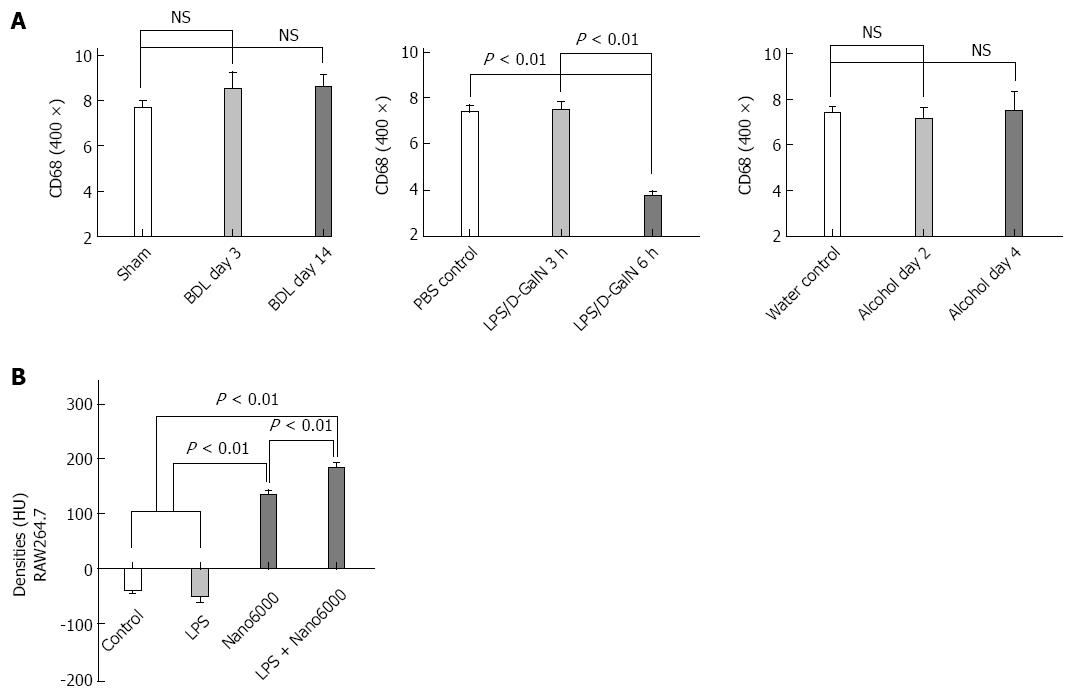
Figure 5 Comparison of the number of CD68+ cells in the injured livers of the three models (A); comparison of the densities of RAW264.
7 cell mass co-cultured with nano6000, lipopolysaccharide or both (B). Values are represented as the means of triplicate values and presented as the mean ± SD.
- Citation: Hua XW, Lu TF, Li DW, Wang WG, Li J, Liu ZZ, Lin WW, Zhang JJ, Xia Q. Contrast-enhanced micro-computed tomography using ExiTron nano6000 for assessment of liver injury. World J Gastroenterol 2015; 21(26): 8043-8051
- URL: https://www.wjgnet.com/1007-9327/full/v21/i26/8043.htm
- DOI: https://dx.doi.org/10.3748/wjg.v21.i26.8043


