Copyright
©The Author(s) 2015.
World J Gastroenterol. Jul 7, 2015; 21(25): 7824-7833
Published online Jul 7, 2015. doi: 10.3748/wjg.v21.i25.7824
Published online Jul 7, 2015. doi: 10.3748/wjg.v21.i25.7824
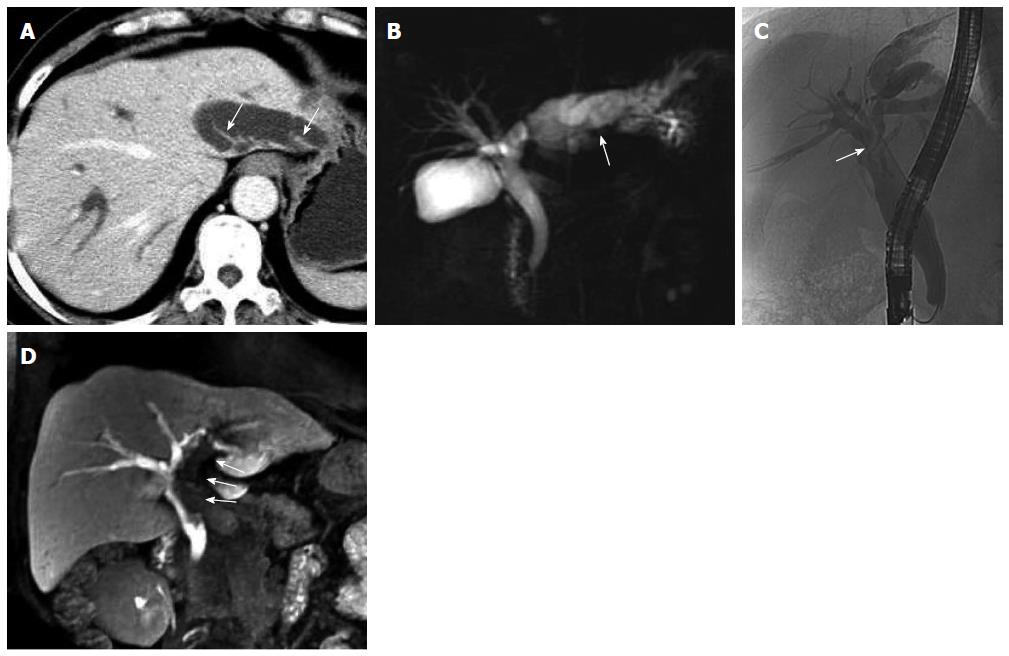
Figure 1 Fifty-nine-year-old female patient with intraductal papillary mucinous neoplasm of the bile duct (case 1).
A: Axial contrast-enhanced computed tomography in the portal phase; B: Magnetic resonance cholangiopancreatography showed extensive intra- and extrahepatic bile duct dilatation and multiple hydra-like protrusions (arrows) in the markedly dilated left intrahepatic bile duct (arrow); C: Endoscopic retrograde cholangiopancreatography showed extensive intra- and extrahepatic bile duct dilatation, particularly in the left intrahepatic and common bile ducts. Bile ducts in the liver hilar appeared more transparent due to the local aggregation of mucin (arrow); D: Multiple planar reconstruction of gadolinium-ethoxybenzyl-diethylenetriamine-pentaacetic acid-enhanced magnetic resonance imaging in the hepatobiliary phase showed dilatation of the bile duct and filling defects in the left intrahepatic and common bile ducts, with a cup-shaped contrast filling edge (arrows). The filling defects were caused by mucus retention, which was confirmed by endoscopy.
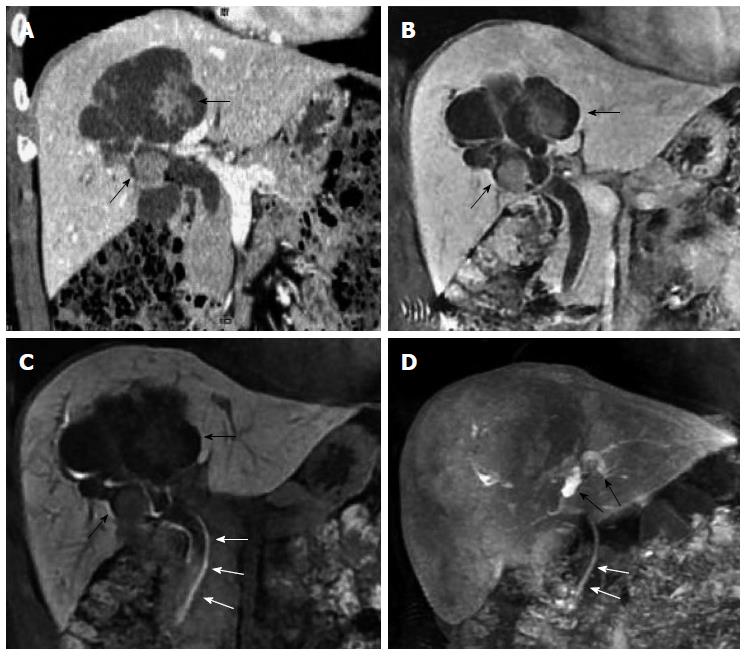
Figure 2 Fifty-two-year-old male patient with cystic intraductal papillary mucinous neoplasm of the bile duct (case 2).
A: Coronal image of contrast-enhanced computed tomography; B: Gadolinium-ethoxybenzyl-diethylenetriamine-pentaacetic acid-enhanced magnetic resonance imaging (Gd-EOB-DTPA-enhanced MRI) in the portal venous phase showed extensive biliary and aneurysmal dilatations of the right intrahepatic bile duct, with multiple significantly enhanced masses within the lumen (black arrows); C: Gd-EOB-DTPA-enhanced MRI also showed a contrast-filling defect within the common bile duct (white arrows), suggesting the presence of mucin; D: Multiple planar reconstruction of images acquired in the hepatobiliary phase showed a dilated left intrahepatic bile duct with good contrast filling (black arrows). The contrast filling was incomplete in the right intrahepatic and common bile ducts (white arrows).
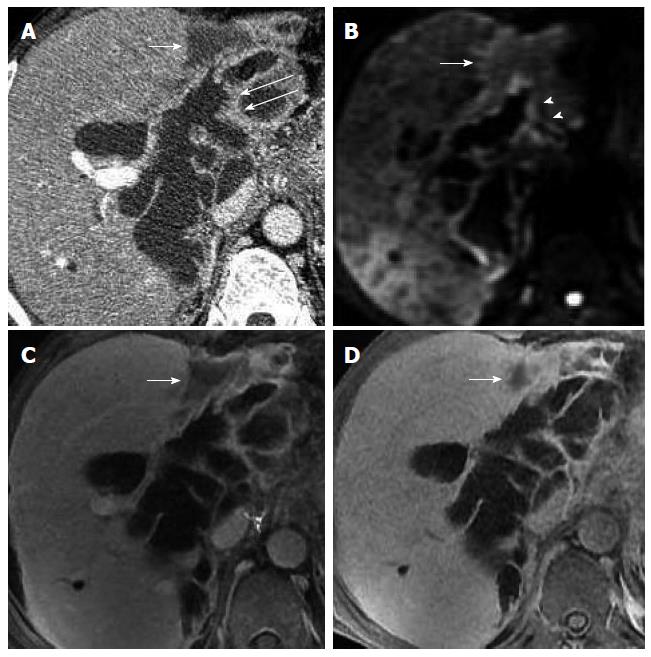
Figure 3 Seventy-two-year-old female patient with malignant intraductal papillary mucinous neoplasm of the bile duct (case 3).
A: Axial image of enhanced computed tomography in the portal venous phase showed extensive intra- and extrahepatic bile duct dilatation with multiple hydra-like protrusions (arrows); B: Dilation appeared hyperintense (arrows) with diffusion-weighted imaging; C: Hypointense (arrows) with T2-weighted imaging; D: Gadolinium-ethoxybenzyl-diethylenetriamine-pentaacetic acid-enhanced magnetic resonance imaging in the hepatobiliary phase revealed no hyperintense bile with distribution of the contrast agents in the dilated bile duct, indicating a large amount of mucin retention, which was confirmed by endoscopy.
Figure 4 Sixty-six-year-old male patient with malignant intraductal papillary mucinous neoplasm of the bile duct (case 4).
A: Axial image of contrast-enhanced computed tomography in the portal venous phase showed a patchy hypointense area abutting the dilated bile ducts in the front edge of the left liver lobe (white arrow), and multiple small nodules distributed along the bile duct wall within the lumen (white long arrows); B: These nodules were hyperintense (white arrowheads) with diffusion-weighted imaging; C: Gadolinium-ethoxybenzyl-diethylenetriamine-pentaacetic acid-enhanced magnetic resonance imaging (Gd-EOB-DTPA-enhanced MRI) in the portal venous phase also showed a patchy hypointense area abutting the dilated bile ducts (white arrow); D: The patch (white arrow) appeared smaller with Gd-EOB-DTPA-enhanced MRI in the hepatobiliary phase, due to the gradual filling of contrast agent, which suggests the presence of functional liver cells. The patchy area was thought to be an inflammatory change secondary to the tumor.
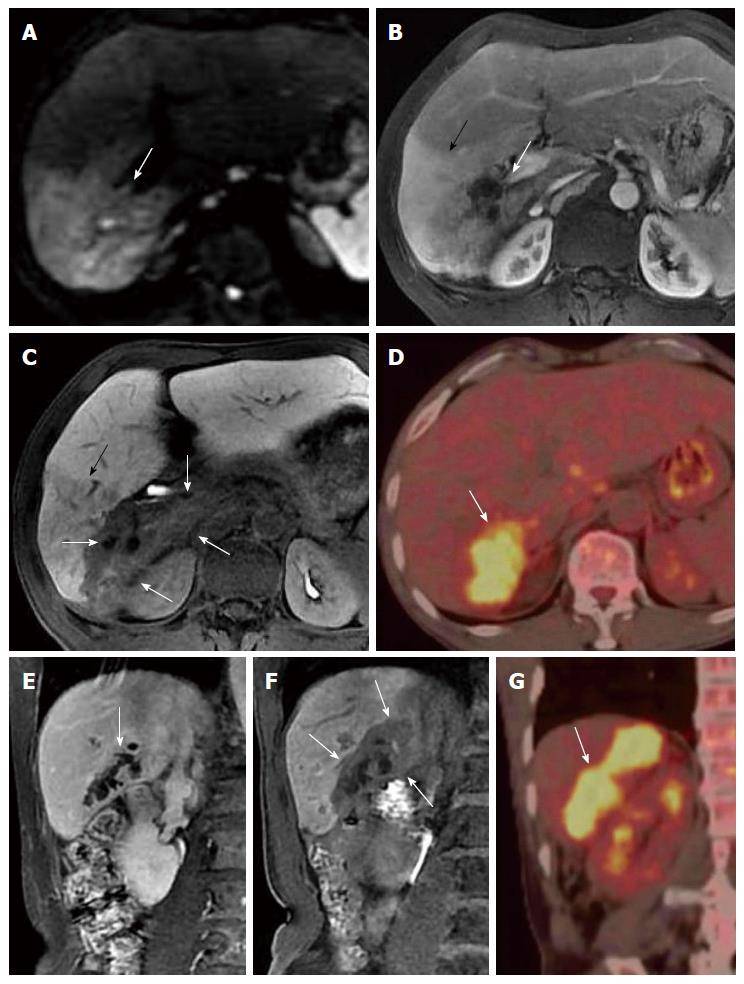
Figure 5 Fifty-six-year-old male patient with infiltrative intraductal papillary mucinous neoplasm of the bile duct (case 5).
A: Diffusion-weighted imaging showed a hyperintense area in segment VI of the liver (white arrow); B: Gadolinium (Gd)-diethylenetriamine-pentaacetic acid (DTPA)-enhanced magnetic resonance imaging (MRI) in the portal venous phase showed marked enhancement in the anterior subsegment (black arrow) and a slightly hypointense area in the posterior subsegment of segment VI (white arrow); C: Gd-ethoxybenzyl (EOB)- -DTPA-enhanced MRI in the hepatobiliary phase revealed bile duct dilatation in the posterior subsegment of segment VI without contrast filling. The hypointense area around the dilated bile duct indicated tumor infiltration to the surrounding tissue (white arrows). The anterior subsegment of segment VI with a slightly decreased low signal intensity suggested an inflammatory change (black arrow); D: Positron emission tomography-computed tomography (CT) confirmed the tumor in the posterior subsegment of segment VI with substantial uptake of fluorodeoxyglucose (white arrow), suggesting active tumor metabolism; E: Coronal Gd-DTPA-enhanced MRI in the equilibrium phase showed serrated changes in the bile duct wall of the posterior subsegment of segment VI, and the extra-biliary tumor infiltration was not well identified (white arrow); F: Gd-EOB-DTPA-enhanced MRI in the hepatobiliary phase showed bile duct dilatation in the posterior subsegment of segment VI without contrast filling. The tumor infiltration surrounding the dilated bile duct was hypointense and well defined (white arrows); G: Fluorodeoxyglucose uptake by the tumor (white arrow) was also shown in the posterior subsegment of segment VI during positron emission tomography-CT.
- Citation: Ying SH, Teng XD, Wang ZM, Wang QD, Zhao YL, Chen F, Xiao WB. Gd-EOB-DTPA-enhanced magnetic resonance imaging for bile duct intraductal papillary mucinous neoplasms. World J Gastroenterol 2015; 21(25): 7824-7833
- URL: https://www.wjgnet.com/1007-9327/full/v21/i25/7824.htm
- DOI: https://dx.doi.org/10.3748/wjg.v21.i25.7824


