Copyright
©The Author(s) 2015.
World J Gastroenterol. Jun 28, 2015; 21(24): 7529-7544
Published online Jun 28, 2015. doi: 10.3748/wjg.v21.i24.7529
Published online Jun 28, 2015. doi: 10.3748/wjg.v21.i24.7529
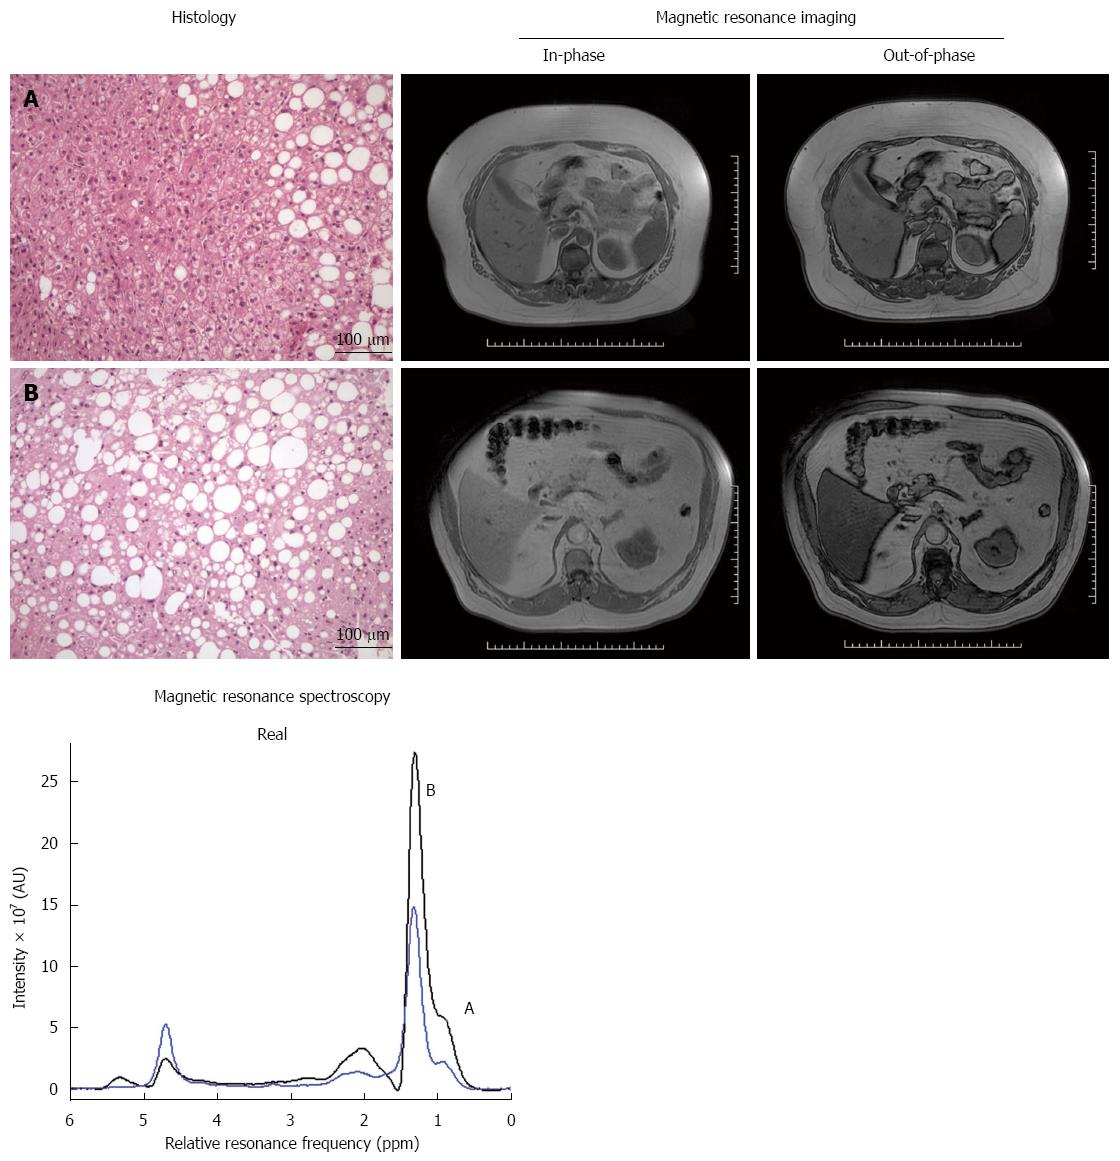
Figure 1 Representative results obtained with the methods described in patients with low (A) and severe fatty liver disease (B).
The resulting spectra were drawn in blue and black, respectively. Scale bar in pictures under Histology title represents 100 μm (magnification × 100).
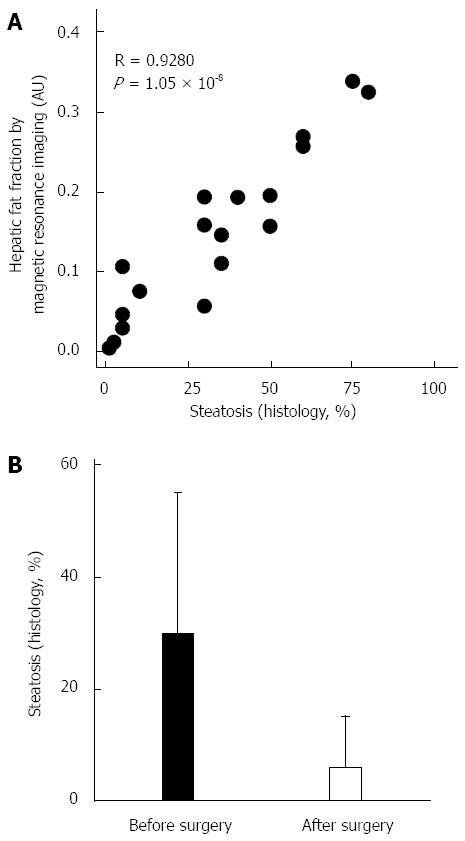
Figure 2 Correlation between hepatic steatosis measured by magnetic resonance imaging and by histological analysis before surgery (A); non-alcoholic fatty liver disease was considerably reduced after one year in all patients (B).
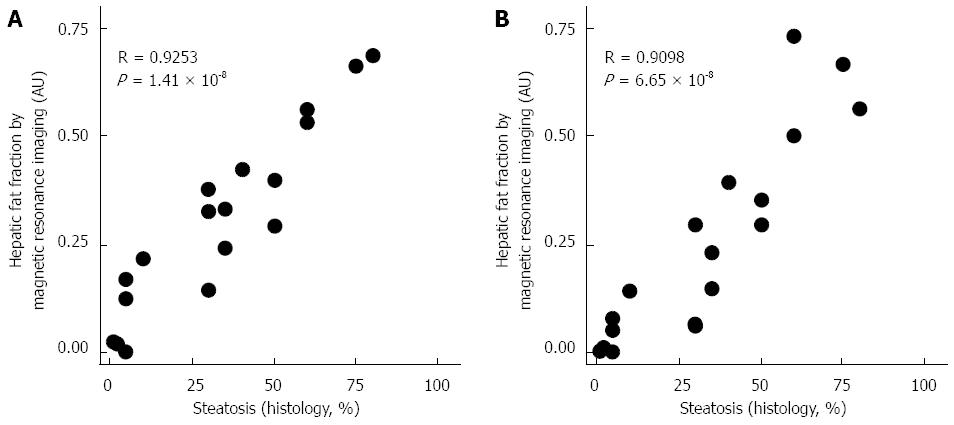
Figure 3 Magnetic resonance imaging signal was further corrected by the spleen (A) or muscle (B) intensity signals, but this did not improve the quality of the correlation with hepatic steatosis assessed by histological analysis.
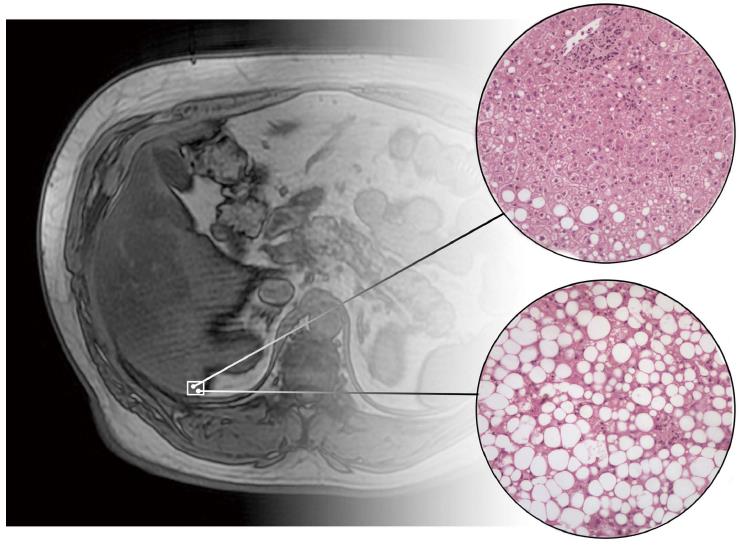
Figure 4 Liver fat distribution is commonly non-homogeneous in non-alcoholic fat liver disease, and this fact could influence the diagnosis of steatosis.
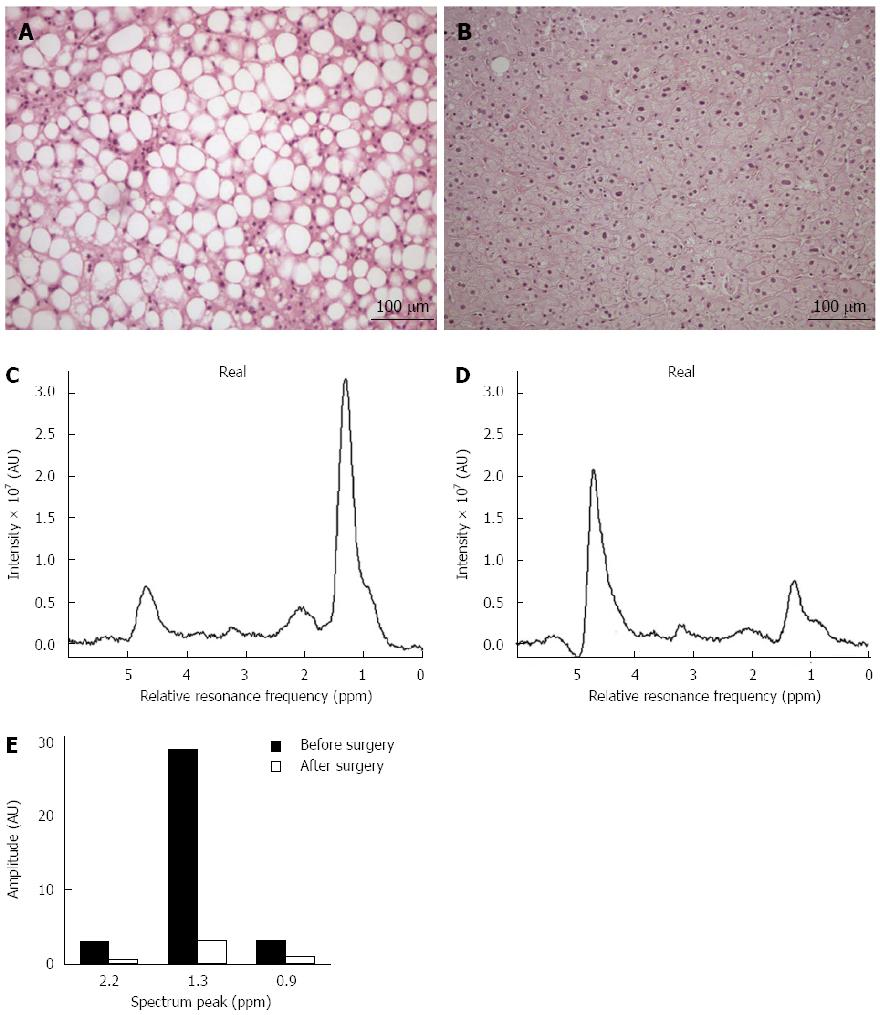
Figure 5 Hepatic steatosis was evaluated in patients before and after surgery in liver biopsy (A, B); the decrease in hepatic fat content also could be visualized by magnetic resonance spectroscopy (C, D), where the peaks that offer more information were those at 0.
9, 1.3 and 2.2 ppm (E). Scale bar in A and B represents 100 μm (magnification × 100).
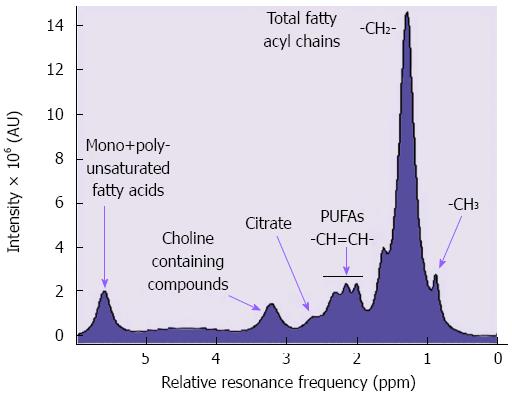
Figure 6 Representative spectrum of identifiable metabolites with magnetic resonance spectroscopy in vivo: 0.
9 ppm - terminal carbon (-CH3); 1.3 ppm - total fatty acyl chains (-CH2-); 2.0-2.2 ppm - poly-unsaturated fatty acids (-CH2=CH2-); 2.6 ppm -Citrate; 3.2 ppm - choline containing compounds; 5.3-5.6 ppm - mono+polyunsaturated fatty acids. Water relative resonance frequency appears at 4.7 ppm as major compound. In this case, water is suppressed for facilitate the visualization of other detectable compounds.
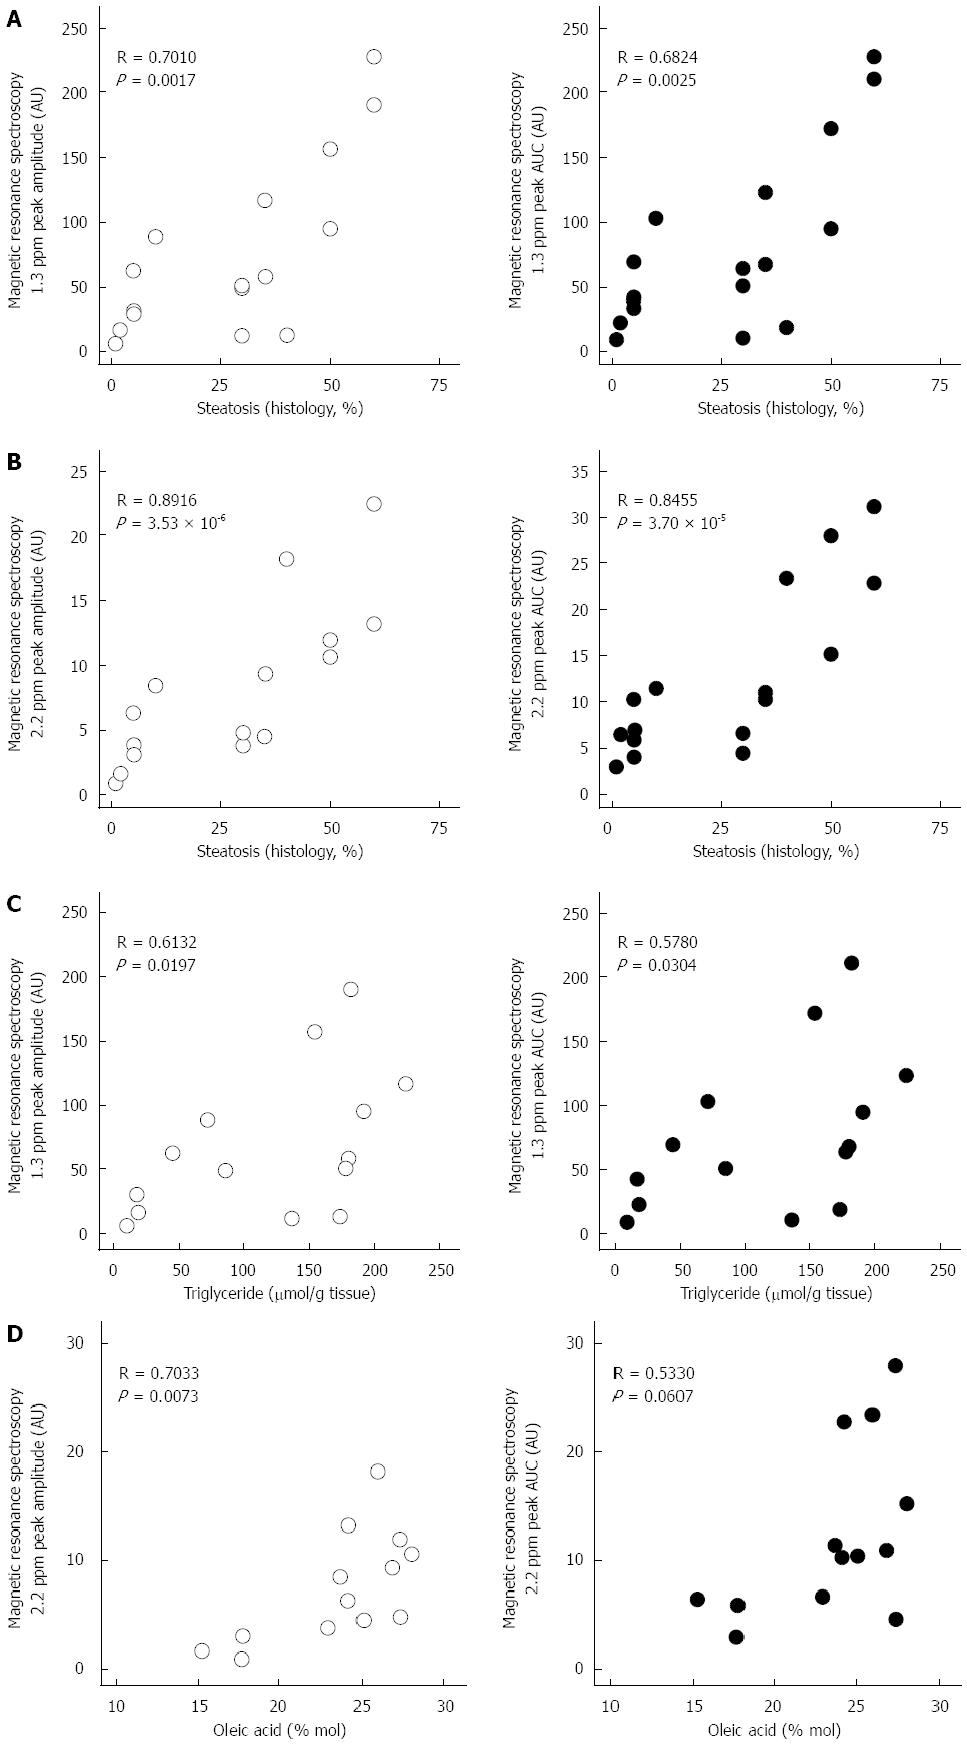
Figure 7 Similar results were obtained using the following methods of calculation: Amplitude of the peaks measurement (left open-circle plots) and area under the curve (AUC, right black-circle plots).
The most important peaks associated with fat are at 1.3 ppm (A) and 2.2 ppm (B). 1.3 ppm peak is mainly associated with triglycerides (C) while 2.2 ppm peak is associated with unsaturations (D).
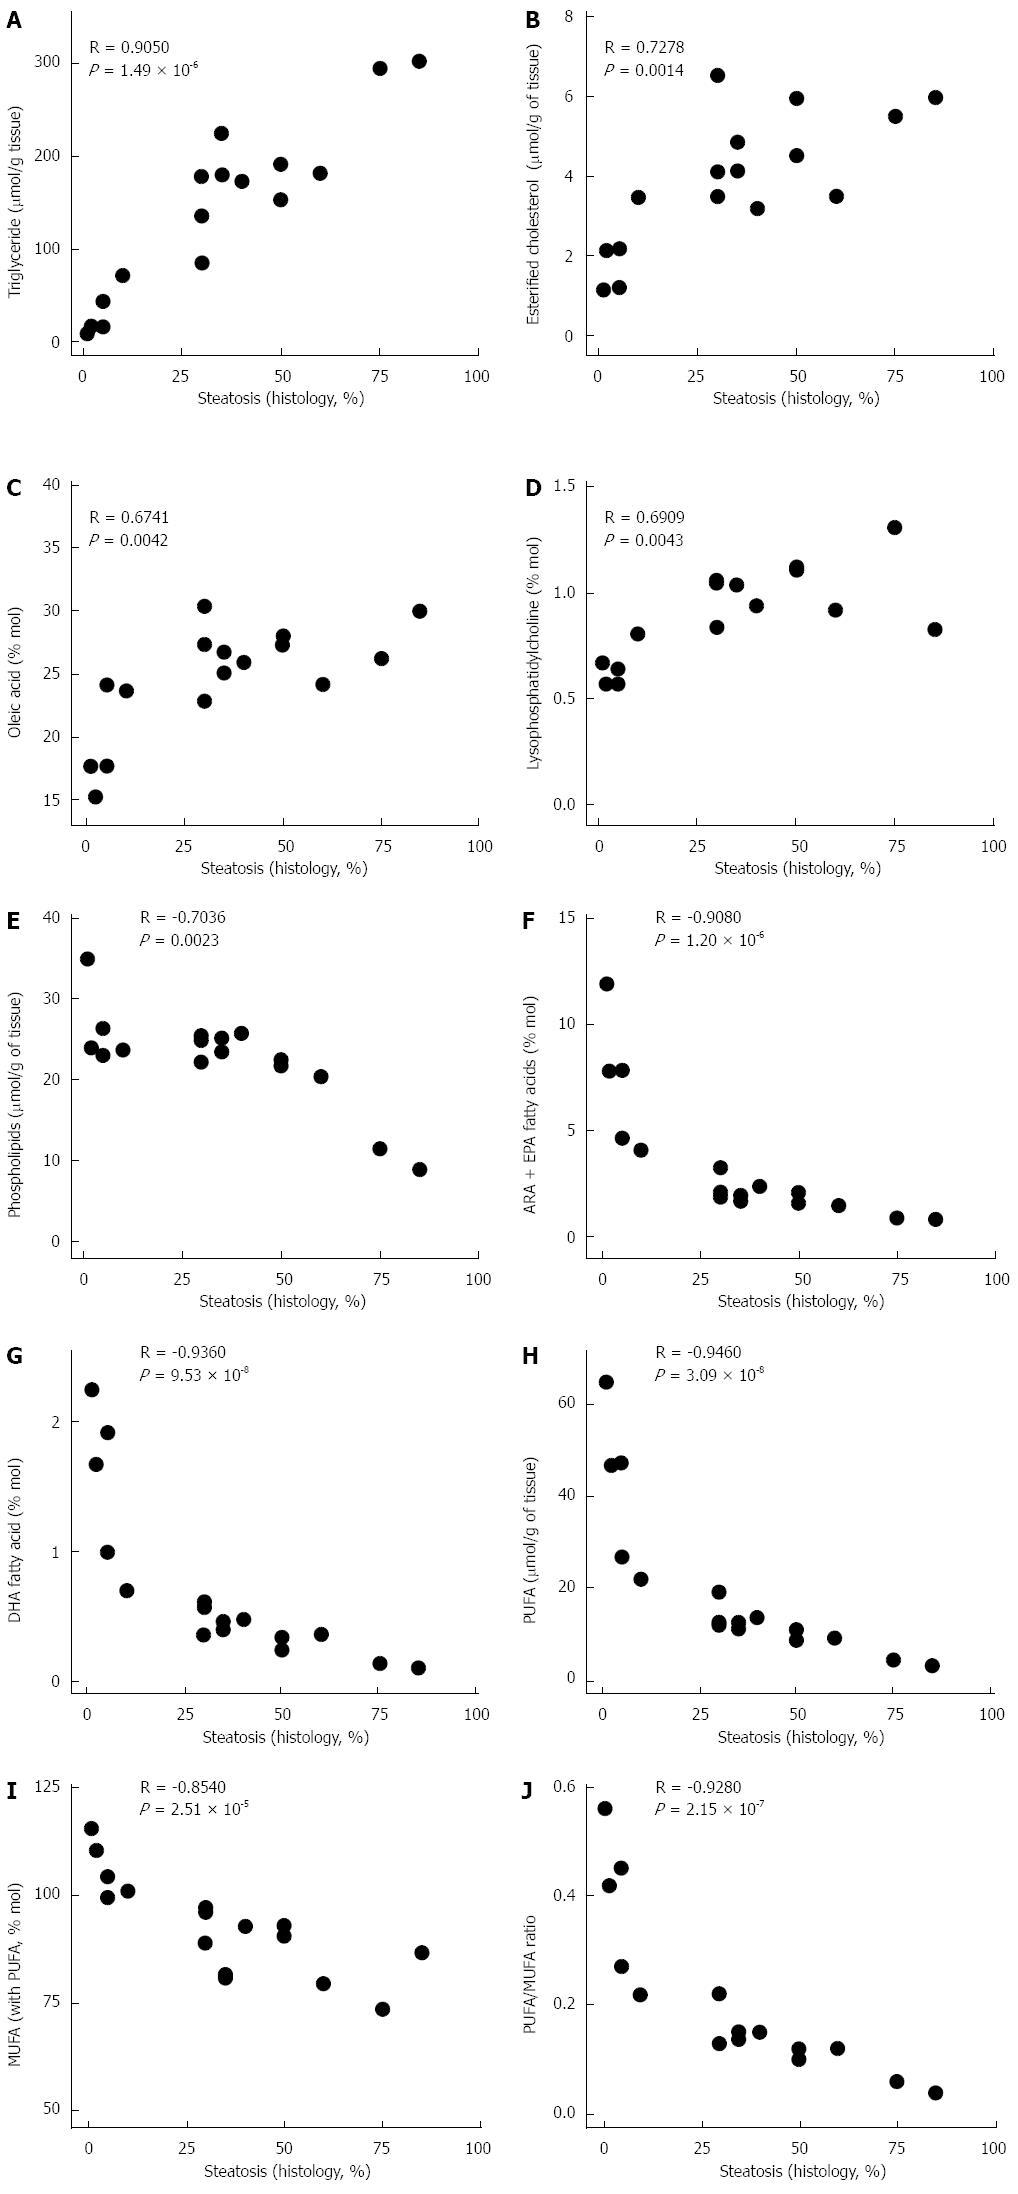
Figure 8 Several lipidic metabolites measured using 1H NMR-based metabolomics were clearly positively associated with hepatic steatosis (A-D); Others showed the opposite behavior (E-J).
ARA: Arachidonic acid; EPA: Eicosapentaenoic acid; DHA: Docosahexaenoic acid; PUFA: Poly-unsaturated fatty acids; MUFA: Mono-unsaturated fatty acids.
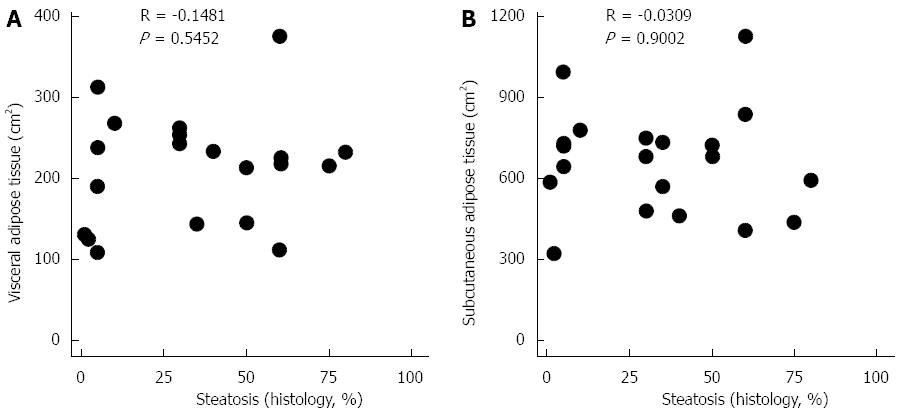
Figure 9 Body fat content was measured using magnetic resonance imaging.
Both visceral (A) and subcutaneous adipose tissue (B) were not related to the development of non-alcoholic fatty liver disease.
- Citation: Calvo N, Beltrán-Debón R, Rodríguez-Gallego E, Hernández-Aguilera A, Guirro M, Mariné-Casadó R, Millá L, Alegret JM, Sabench F, del Castillo D, Vinaixa M, Rodríguez M&, Correig X, García-Álvarez R, Menendez JA, Camps J, Joven J. Liver fat deposition and mitochondrial dysfunction in morbid obesity: An approach combining metabolomics with liver imaging and histology. World J Gastroenterol 2015; 21(24): 7529-7544
- URL: https://www.wjgnet.com/1007-9327/full/v21/i24/7529.htm
- DOI: https://dx.doi.org/10.3748/wjg.v21.i24.7529


